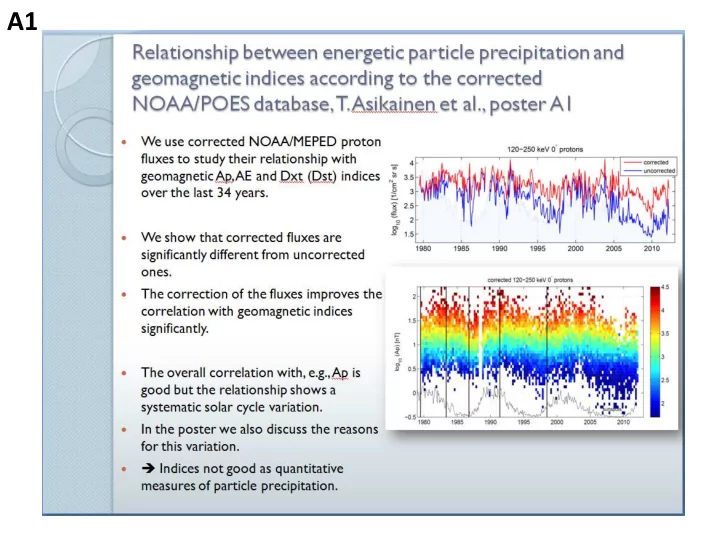

A1
A2
A3
A4
A6
C1
C2
C3
C5 Effect of electron precipitation on Winter time surface temperature and North Atlantic oscillation 30-100 keV D1 vs. NAO 100-300 keV D2 vs. NAO Correlation Range of between D1 temperature and variation temperature caused by D1 Correlation Range of between D2 temperature and variation temperature caused by D2
C6
Projection of the 11-yr solar cycle signal on internal modes of the tropical Pacific decadal variability C7 Stergios Misios and Hauke Schmidt Ensemble simulations with Observations MAECHAM5/MPIOM • In observations there is a Tropical Pacific Quasi-Decadal Oscillation (TPQDO). • We simulate a similar Tropical Pacific Quasi-Decadal Oscillation that synchronizes with the solar cycle forcing (decadal predictability?). • Come to the poster for the mechanism…
C8 Solar cycle signals in the Pacific and the issue of timings Solar cycle signals in the Pacific and the issue of timings Solar cycle signals in the Pacific and the issue of timings Indrani Roy 1 and Joanna D. Haigh, Imperial College London 3. Solar signal in SLP and “climate change” 2. Solar signal in SST: the issue of timings 1 Current : University of Exeter, UK Scatter Plot Regression 1856-1957 Question: What (if any) are solar cycle signals in SST and SLP in Pacific – taking account of climate change ? 1. SLP: solar signal using SSN peak year compositing 1958-1997 • Marked overall association of higher solar activity with colder temperatures • No consistent ENSO-like variation in tropical SSTs following peak yrs of sunspot cycle. in E. tropical Pacific; weakened during 1950s – 1997 (left) • Signal S. Pacific (v.L. and Meehl (2011)) sensitive to years chosen for composites. • 9 cycles cold at peak SSN year, 4 remain cold for the following two years and 5 warm. • SLP signal in N. Pacific weaker during latter period (right). • Signal in N. Pacific, near Aleutian Low is strong, independent of choices of years. • ‘Lagged warm response’ occurs during 5 of 14 cycles, when ENSO activity higher. • During 1958-1997, solar effect was masked by more dominant ENSO.
On the Controversy of Extreme Solar Particle Event Signatures in Arctic Ice Cores: Sun to Ice? Harlan E. Spence (University of New Hampshire) and the NSF- funded “Sun -to- Ice” Science team, with special “HEPPA” thanks to J. Dibb, C. Jackman, K. Duderstadt, D. Marsh, C. Randall, and S. Solomon • Over past two decades, space science and glaciochemistry communities presented conflicting arguments over whether SEPs can/do produce nitrate signatures in polar ice cores • Debate over SEP-source has sharpened in last five years • Better articulation of issues and broader data sets have begun to resolve elements of controversy • Controversy still remains about if any and how SEPs can produce any nitrate signal • Regardless, latest Wolff result demonstrates that (even if SEP-related) spikes could not likely be used to create a meaningful statistical history because of low reproducibility of nitrate signature in multiple cores • Sun-to-Ice Project is a multipronged effort to resolve remaining questions with respect to nitrates • Combination of data mining, broader data sets, revisiting techniques and dating, and new experimental studies • Hope to resolve remaining controversies in next few years C9 • Will also address many other science topics, including HEPPA effects, too!!
C10
Recommend
More recommend