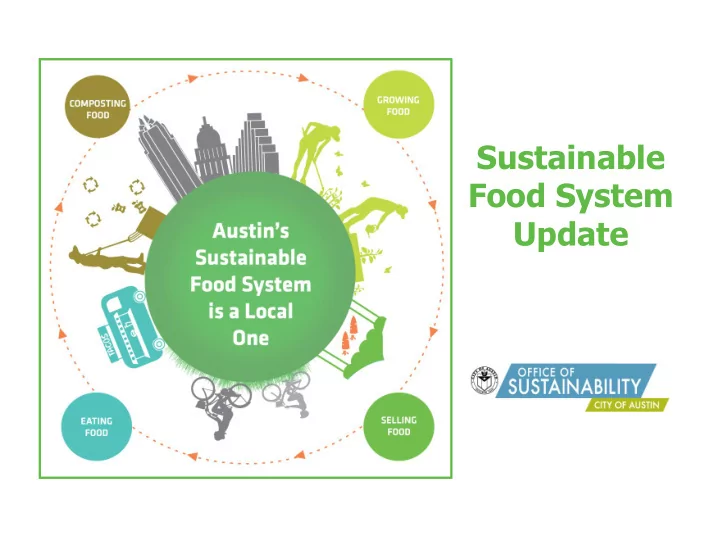

Sustainable Food System Update
Agenda Role a Food Policy Manager Progress Update Metrics Development • Gap Analysis • Food Portal Launch • State of the Food System Report What’s Next
Role a Food Policy Manager Cities impact and influence on a food system Coordinating inter- departmental activity Leadership to achieve goals stated in 30 year comprehensive plan
Progress Update Metrics Development: More than 150 meetings • with stakeholders Conducted a survey to • identify metrics: Growing food • Selling food • Eating food • Food recovery • Collected data for selected • metrics
Progress Update Gap Analysis: Access • Competition • Demand • Regulations • Policies • Costs •
Progress Update Food Portal Launch: Educational materials • How to donate food • How to compost • Ways to eat healthy • Codes and regulations • Starting a business • Starting a community garden • Organizations • Helping with hunger • Ways to donate food • Where to buy local food •
Input and Discussion State of the Food System Report
State of the Food System Report Purpose: Educate • Snapshot of current food system • Identifies trends • Easily understood – highly graphic • Links to existing goals • Imagine Austin/ CHIP • COA programs and initiatives • Organize priorities and action • Creates a common framework • Engages community partners • Identifies a path to change •
Limits to Food System Report • This is a only starting point • Challenges: • Metrics cover different geographical areas • Trends are difficult to track • COA has a limited direct impact • Complexity of global food system / City boundaries
Growing Food Metrics: 11 year farmland loss = 25% • 9.3 acres/ day • Total community gardens = 52 • Available plots = 0 (wait lists) • AISD Schools with gardens = 77% • Supply of food at any time = 3 days • Average age of farmers = 62 • Average farm worker income = $11K • Vacant Land in Austin
Growing Food Takeaways: Preserving farmland requires • innovative approach Products grown in Central • Texas are a small percentage of what we eat School, community, and urban • gardens are in high demand Farmer demographics must be • addressed
Growing Food COA Profile Private Sector Profiles Parks and Recreation Multi-cultural Refugee Center’s Community Community Garden guidelines Garden Austin Water Agua Dulce Rainwater Rebate Impact of UFO COC Community Garden water- taps Planning and Development Urban Farm Ordinance - Certificate of Compliance
Selling Food Metrics: Travis County Selling local food is a significant • part of Austin’s economy: Total economic impact = $4.1B (.45% of • GDP in Austin MSA) Food manufacturing = $737M • Food distribution = $331M • Grocery sales = $449M • Farm direct sales = $1.3M • COA sales tax revenue = $63M (43% of • Crops sold in $ millions total COA income) Acres of farmland in thousands
Selling Food Takeaways: Buying local food benefits: • Producers • Consumers • Local economy • Environment • More local processing & • manufacturing is needed Local selling mechanisms need • evaluation & improvement: # of farmers markets & fee structure • Demand exceeds supply for institutional • buyers Geographical distribution of grocery stores •
Selling Food COA Profile Private Sector Profiles Health and Human Sustainable Food Center Services Farmers Market Double Dollar programs Farmers Market Regulations Odd Duck – Bryce Human Resource Gilmore Farm to Work program Transformation from a food truck to a brick and mortar Economic Development restaurant Economic Impact study
Eating Food Metrics: Food insecure = 17.6% • Only 57% of eligible residents • receive SNAP Food insecurity costs Texas $9B • per year Eligible School Lunch program: • Free and Reduced = 63% • Obesity rate = 25.5% • Diabetes rate = 7.4% • Food retail = over 6,000 restaurants • Austin Food Desert Map and 85 full service grocery stores
Eating Food Takeaways: Food insecurity • disproportionately impacts: Children • Minorities • Elderly • Many Austinites do not have • healthy eating habits Priorities for improvement: • Increased access to healthy food • Improve planning for healthy food • Addressing affordability • Education and outreach •
Eating Food COA Profile Private Sector Profiles Transportation CAP Metro Access to healthy food Grocery Store routes Health and Human Capital Area Food Bank Services SNAP outreach WIC Programs
Food Recovery Metrics: Food waste = 421,500,000 lbs. • per year / $208M Households with access to • curbside composting = 14,322 Organic material diverted = • 1,837 tons Keep Austin Fed recovers • 360,000 pounds/year ARR composting classes = 50 •
Food Recovery Takeaways: Benefits of food recovery: • Reduces food insecurity • Achieves Zero Waste goal • Saves money • Conserves resources • Reduces climate change impacts • 25% food waste = 25% food • insecurity Specific strategies should be • developed for: Residents, businesses, schools & • institutions Neighborhood-scale solutions • Providing compost to local farms •
Food Recovery COA Profile Private Sector Profiles Austin Resource Recovery Eastside Compost Peddlers Residential and business pilots Keep Austin Fed Food Recovery UT Arlington/ Eco- Network Food Waste Charter
What’s Next? Austin’s Local, Healthy and Sustainable Food System Neighborhood Food Planning • Gather data on 4 sectors of the food system • Aggregate data from • Select food system metrics • Establish best-practices Neighborhood Food Plans with ties to Imagine Austin • Develop Pilot Projects (Dove • Integrate Food Plan with • Develop City of Austin Springs/Rundberg/ Seaholm Imagine Austin and CHIP internal Food System Eco District) Roundtable • Evaluate impact and • Identify food system metrics opportunities for future for neighborhoods • Develop external food collaboration system stakeholder groups • Work with neighborhood stakeholders to identify Austin Food System priorities Austin State of the Strategic Plan • Develop neighborhood food Food System Report system plans • Develop tool-kit to assist in achieving desired changes 2015 2017/2018 2015/2016
Edwin Marty, Food Policy Manager edwin.marty@austintexas.gov
Recommend
More recommend