Studying the effect of species dominance on diversity patterns using - PowerPoint PPT Presentation
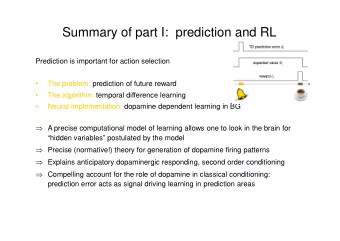
Studying the effect of species dominance on diversity patterns using Hill numbers-based indices Lo c Chalmandrier Lo c Chalmandrier Diversity pattern analysis November 8th 2017 1 / 14 Introduction Diversity & Filters Assembly
Studying the effect of species dominance on diversity patterns using Hill numbers-based indices Lo¨ ıc Chalmandrier Lo¨ ıc Chalmandrier Diversity pattern analysis November 8th 2017 1 / 14
Introduction Diversity & Filters Assembly theory - From patterns to processes � Meta-community diversity is the result of ecological processes that can be identified by studying the structure of communities Lo¨ ıc Chalmandrier Diversity pattern analysis November 8th 2017 2 / 14
Introduction Diversity & Filters Assembly theory - From patterns to processes � Meta-community diversity is the result of ecological processes that can be identified by studying the structure of communities Lo¨ ıc Chalmandrier Diversity pattern analysis November 8th 2017 2 / 14
Introduction Diversity & Filters Assembly theory - From patterns to processes � Meta-community diversity is the result of ecological processes that can be identified by studying the structure of communities Lo¨ ıc Chalmandrier Diversity pattern analysis November 8th 2017 2 / 14
Introduction Diversity & Filters Assembly theory - From patterns to processes � Meta-community diversity is the result of ecological processes that can be identified by studying the structure of communities � Use of proxies of species ecological niche: functional traits, phylogeny... Lo¨ ıc Chalmandrier Diversity pattern analysis November 8th 2017 2 / 14
Introduction Statistical tools Methodological steps Lo¨ ıc Chalmandrier Diversity pattern analysis November 8th 2017 3 / 14
Introduction Statistical tools Methodological steps Lo¨ ıc Chalmandrier Diversity pattern analysis November 8th 2017 3 / 14
Introduction Statistical tools Methodological steps Lo¨ ıc Chalmandrier Diversity pattern analysis November 8th 2017 3 / 14
Introduction Statistical tools To test a functional/phylo diversity pattern, you need: A diversity index � for a given facet, α, β, γ, σ... � Richesse, Shannon, Rao, MPD, MNTD... � Function of species relative abundances. Lo¨ ıc Chalmandrier Diversity pattern analysis November 8th 2017 4 / 14
Introduction Statistical tools To test a functional/phylo diversity pattern, you need: A diversity index � for a given facet, α, β, γ, σ... � Richesse, Shannon, Rao, MPD, MNTD... � Function of species relative abundances. A species ecological similarity matrix � Different traits, phylogeny. � Link function between data and species ecological similarity metric. Lo¨ ıc Chalmandrier Diversity pattern analysis November 8th 2017 4 / 14
Introduction Statistical tools To test a functional/phylo diversity pattern, you need: A diversity index � for a given facet, α, β, γ, σ... � Richesse, Shannon, Rao, MPD, MNTD... � Function of species relative abundances. A species ecological similarity matrix � Different traits, phylogeny. � Link function between data and species ecological similarity metric. A null model � Null hypothesis . � A species pool . Lo¨ ıc Chalmandrier Diversity pattern analysis November 8th 2017 4 / 14
Testing across diversity indices Why doing it? Diversity index assumptions Choosing Rao’s QE � � QE = d ij p i p j i j Lo¨ ıc Chalmandrier Diversity pattern analysis November 8th 2017 5 / 14
Testing across diversity indices Why doing it? Diversity index assumptions Choosing Rao’s QE � � QE = d ij p i p j i j � Species contribution to diversity proportional to relative abundance . Choler et al. 2001 Lo¨ ıc Chalmandrier Diversity pattern analysis November 8th 2017 5 / 14
Testing across diversity indices Why doing it? Diversity index assumptions Choosing Rao’s QE � � QE = d ij p i p j i j � Species contribution to diversity proportional to relative abundance . � Linear relationship between ecological niche dissimilarity and trait/phy. species distances. Godoy et al. 2014 Lo¨ ıc Chalmandrier Diversity pattern analysis November 8th 2017 5 / 14
Testing across diversity indices Why doing it? Diversity index assumptions Choosing Rao’s QE � � QE = d ij p i p j i j � Species contribution to diversity proportional to relative abundance . � Linear relationship between ecological niche dissimilarity and trait/phy. species distances. Lo¨ ıc Chalmandrier Diversity pattern analysis November 8th 2017 5 / 14
Testing across diversity indices Why doing it? Diversity index assumptions � Dominance effect: how species abundance are taken into account � Similarity effect: how species similarities (functional, phylogenetic) are taken into account Lo¨ ıc Chalmandrier Diversity pattern analysis November 8th 2017 6 / 14
Testing across diversity indices How doing it? The dominance effect: Hill numbers � Derives from information theory � Parametric diversity metric that unified Richness, Shannon, Simpson... � i p q i ) 1 / (1 − q ) D ( q ) = ( � if q � = 1 D (1) = exp ( − � i × ln ( p i ) p i ) if q = 1 Lo¨ ıc Chalmandrier Diversity pattern analysis November 8th 2017 7 / 14
Testing across diversity indices How doing it? The dominance effect: Hill numbers � Derives from information theory � Parametric diversity metric that unified Richness, Shannon, Simpson... � i p q i ) 1 / (1 − q ) D ( q ) = ( � if q � = 1 D (1) = exp ( − � i × ln ( p i ) p i ) if q = 1 � i p 0 D (0) = ( � i ) = N Richesse Lo¨ ıc Chalmandrier Diversity pattern analysis November 8th 2017 7 / 14
Testing across diversity indices How doing it? The dominance effect: Hill numbers � Derives from information theory � Parametric diversity metric that unified Richness, Shannon, Simpson... � i p q i ) 1 / (1 − q ) D ( q ) = ( � if q � = 1 D (1) = exp ( − � i × ln ( p i ) p i ) if q = 1 � i p 0 D (0) = ( � i ) = N Richesse � D (1) = exp ( − � i × ln ( p i ) p i ) Exp. of Shannon entropy Lo¨ ıc Chalmandrier Diversity pattern analysis November 8th 2017 7 / 14
Testing across diversity indices How doing it? The dominance effect: Hill numbers � Derives from information theory � Parametric diversity metric that unified Richness, Shannon, Simpson... � i p q i ) 1 / (1 − q ) D ( q ) = ( � if q � = 1 D (1) = exp ( − � i × ln ( p i ) p i ) if q = 1 � i p 0 D (0) = ( � i ) = N Richesse � D (1) = exp ( − � i × ln ( p i ) p i ) Exp. of Shannon entropy � i ) 1 / (1 − 2) = i p 2 1 D (2) = ( � Inverse of Simpson i p 2 � i Lo¨ ıc Chalmandrier Diversity pattern analysis November 8th 2017 7 / 14
Testing across diversity indices How doing it? The dominance effect: Hill numbers � Derives from information theory � Parametric diversity metric that unified Richness, Shannon, Simpson... � i p q i ) 1 / (1 − q ) D ( q ) = ( � if q � = 1 D (1) = exp ( − � i × ln ( p i ) p i ) if q = 1 � i p 0 D (0) = ( � i ) = N Richesse � D (1) = exp ( − � i × ln ( p i ) p i ) Exp. of Shannon entropy � i ) 1 / (1 − 2) = i p 2 1 D (2) = ( � Inverse of Simpson i p 2 � i � 1 D ( ∞ ) = Indice de Berger-Parker max ( p i ) Lo¨ ıc Chalmandrier Diversity pattern analysis November 8th 2017 7 / 14
Testing across diversity indices How doing it? Properties � Increase when the number of species increases and when species abundances are more even Lo¨ ıc Chalmandrier Diversity pattern analysis November 8th 2017 8 / 14
Testing across diversity indices How doing it? Properties � Increase when the number of species increases and when species abundances are more even � Concave metric of diversity Lo¨ ıc Chalmandrier Diversity pattern analysis November 8th 2017 8 / 14
Testing across diversity indices How doing it? Properties � Increase when the number of species increases and when species abundances are more even � Concave metric of diversity � Quantify species “effective number” (Value between 1 and N). Example � One community with 8 equally abundant species and another with 16 equally abundant species. � With Shannon entropy : 2.07 vs. 2.77; Gini-Simpson : 0.875 vs. 0.9375 � With D(1) : 8 vs. 16; D(2) : 8 vs. 16 Lo¨ ıc Chalmandrier Diversity pattern analysis November 8th 2017 8 / 14
Testing across diversity indices How doing it? Properties � Increase when the number of species increases and when species abundances are more even � Concave metric of diversity � Quantify species “effective number” (Value between 1 and N). � Return “true” estimates of β -diversity ( Jost 2007, Tuomisto 2011 ) beta-diversity � γ / α � Quantifies the “effective number” of site in a meta-community � set between 1 and the number of site � “independent” from the α -diversity Lo¨ ıc Chalmandrier Diversity pattern analysis November 8th 2017 8 / 14
Testing across diversity indices How doing it? Behavior with uneven abundance Example of a two species community � Species richness Lo¨ ıc Chalmandrier Diversity pattern analysis November 8th 2017 9 / 14
Testing across diversity indices How doing it? Behavior with uneven abundance Example of a two species community � Species richness � Exp. of Shannon Lo¨ ıc Chalmandrier Diversity pattern analysis November 8th 2017 9 / 14
Recommend


More recommend
Explore More Topics
Stay informed with curated content and fresh updates.