Studying multi-threaded behavior with TSViz - PowerPoint PPT Presentation
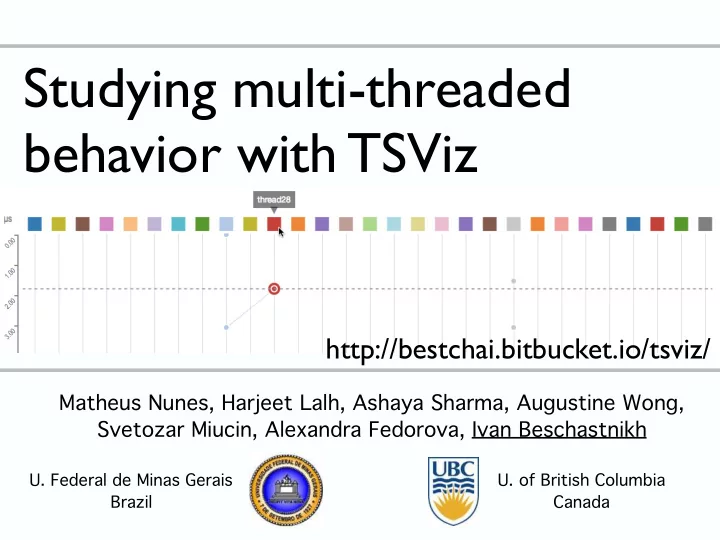
Studying multi-threaded behavior with TSViz http://bestchai.bitbucket.io/tsviz/ Matheus Nunes, Harjeet Lalh, Ashaya Sharma, Augustine Wong, Svetozar Miucin, Alexandra Fedorova, Ivan Beschastnikh U. Federal de Minas Gerais U. of British
Studying multi-threaded behavior with TSViz http://bestchai.bitbucket.io/tsviz/ Matheus Nunes, Harjeet Lalh, Ashaya Sharma, Augustine Wong, Svetozar Miucin, Alexandra Fedorova, Ivan Beschastnikh U. Federal de Minas Gerais U. of British Columbia Brazil Canada
Concurrency is everywhere • Performance: • Moore’s law is dying out • iPhone 7 has 4 CPU cores and 6 GPU cores • Coordination: • Today’s apps depend on numerous services Ivan Beschastnikh University of British Columbia 2
Concurrency is everywhere • Performance: • Moore’s law is dying out Developers must • iPhone 7 has 4 CPU cores and 6 GPU cores embrace concurrency • Coordination: • Today’s apps depend on numerous services Ivan Beschastnikh University of British Columbia 3
Concurrency complexities • Multi-threading with shared state is the dominant model • Challenging to reason about order of events • Requires explicit concurrency control (e.g., locks) • Few tools support concurrency comprehension • Commonly used tools: profilers/tracing tools • Many tools target distributed computing/systems • Most devs study logs, one per thread [1] Debugging Distributed Systems: Challenges and options for validation and debugging, Beschastnikh et al. CACM 2016 [2] Combing the Communication Hairball: Visualizing Parallel Execution Traces using Logical Time. Isaacs et al. TVCG 2014 [3] Ordering Traces Logically to Identify Lateness in Message Passing Programs. Isaacs et al. TPDS 2016 Ivan Beschastnikh University of British Columbia 4
Concurrency analysis in the small Our view: understanding inter-thread interactions require understanding runtime behavior in the small • A solution requires two pieces: 1. Instrumentation • e.g., LLVM-based tool called DINAMITE [1] 2. Interactive visualization of captured information • TSViz: a new tool based on ShiViz [2] [1] End-to-end Memory Behavior Profiling with DINAMITE. Miucin et al. Tool demo at FSE 2016 [2] Debugging Distributed Systems: Challenges and options for validation and debugging, Beschastnikh et al. CACM 2016 Ivan Beschastnikh University of British Columbia 5
Concurrency analysis in the small Our view: understanding inter-thread interactions require understanding runtime behavior in the small • A solution requires two pieces: 1. Instrumentation • e.g., LLVM-based tool called DINAMITE [1] 2. Interactive visualization of captured information Focus of this talk • TSViz : a new tool based on ShiViz [2] [1] End-to-end Memory Behavior Profiling with DINAMITE. Miucin et al. Tool demo at FSE 2016 [2] Debugging Distributed Systems: Challenges and options for validation and debugging, Beschastnikh et al. CACM 2016 Ivan Beschastnikh University of British Columbia 6
DINAMITE: LLVM-based tracer • Can instrument functions, mutexes, memory allocations and accesses… • Instrument what you care about (or use reasonable defaults) • Possibility of analysis on the fly • Controllable overhead between 10% and 30x • Get all the debug information in logs! (even at -O3) • People in our lab use it daily for performance debugging https://dinamite-toolkit.github.io/ Ivan Beschastnikh University of British Columbia 7
Recommend
More recommend
Explore More Topics
Stay informed with curated content and fresh updates.
