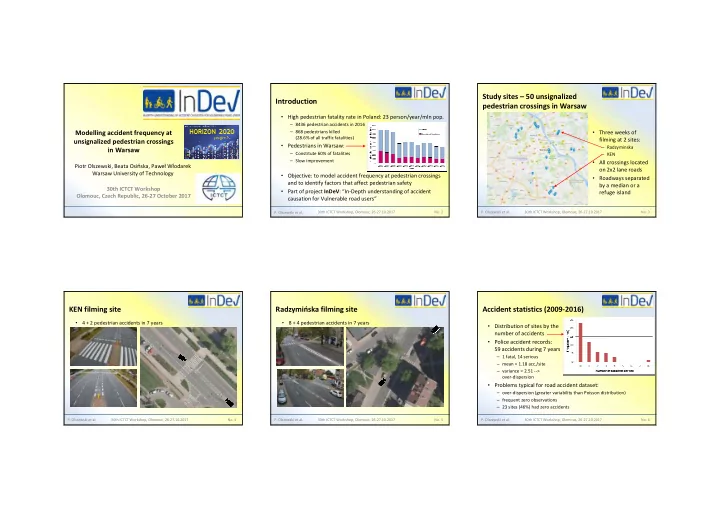

Study sites – 50 unsignalized Introduction pedestrian crossings in Warsaw • High pedestrian fatality rate in Poland: 23 person/year/mln pop. – 8436 pedestrian accidents in 2016 Modelling accident frequency at – 868 pedestrians killed • Three weeks of (28.6% of all traffic fatalities) filming at 2 sites: unsignalized pedestrian crossings • Pedestrians in Warsaw: – Radzyminska in Warsaw – Constitute 60% of fatalities – KEN – Slow improvement • All crossings located Piotr Olszewski, Beata Osi ń ska, Pawe ł W ł odarek on 2x2 lane roads Warsaw University of Technology • Objective: to model accident frequency at pedestrian crossings • Roadways separated and to identify factors that affect pedestrian safety by a median or a 30th ICTCT Workshop • Part of project InDeV : “In-Depth understanding of accident refuge island Olomouc, Czech Republic, 26-27 October 2017 causation for Vulnerable road users” 30th ICTCT Workshop, Olomouc, 26-27.10.2017 No. 2 P. Olszewski et al. 30th ICTCT Workshop, Olomouc, 26-27.10.2017 No. 3 P. Olszewski et al. KEN filming site Radzymińska filming site Accident statistics (2009-2016) • 4 + 2 pedestrian accidents in 7 years • 8 + 4 pedestrian accidents in 7 years • Distribution of sites by the number of accidents • Police accident records: 59 accidents during 7 years – 1 fatal, 14 serious – mean = 1.18 acc./site – variance = 2.51 --> over-dispersion • Problems typical for road accident dataset: – over-dispersion (greater variability than Poisson distribution) – frequent zero observations – 23 sites (46%) had zero accidents P. Olszewski et al. 30th ICTCT Workshop, Olomouc, 26-27.10.2017 No. 4 P. Olszewski et al. 30th ICTCT Workshop, Olomouc, 26-27.10.2017 No. 5 P. Olszewski et al. 30th ICTCT Workshop, Olomouc, 26-27.10.2017 No. 6
Accident prediction model Daily traffic volume estimation Variable description & statistics • Volumes of pedestrian and eq (1) vehicle traffic were counted – Six sites: 24 h counts – Remaining sites: 3x1 hour counts: 7-8, 12-13, 16-17 • Pedestrian volume model DPV = 5.65 P 7 + 9.62 P 12 + 2.1 P 16 (R 2 = 0.999) • Motor traffic volume model DTV = 3.87 T 7 + 7.53 T 12 + 4.17 T 16 (R 2 = 0.999) P. Olszewski et al. 30th ICTCT Workshop, Olomouc, 26-27.10.2017 No. 7 P. Olszewski et al. 30th ICTCT Workshop, Olomouc, 26-27.10.2017 No. 8 P. Olszewski et al. 30th ICTCT Workshop, Olomouc, 26-27.10.2017 No. 9 Results of model estimation - 1 Poisson or Negative Binomial? CURE plots • Eq (1) can be estimated assuming different statistical models: • Negative Binomial distribution is usually preferable – here it has: • Cumulative residuals can Poisson, Negative Binomial, Zero-inflated - Poisson or NB – lower (=better) AIC value but be plotted, sorted by the – lower (=worse) pseudo R 2 and lower significance of explanatory variables sum of traffic volumes • Test for over-dispersion: CT (Cameron-Trivedi) is not conclusive – it shows that Poisson distribution cannot be rejected • Poisson 1 model • Conclusion: • Negative Binomial model – Poisson acc./year • Both models perform – NB acc./year well – cumulative residuals are within 2 std. error bands P. Olszewski et al. 30th ICTCT Workshop, Olomouc, 26-27.10.2017 No. 10 P. Olszewski et al. 30th ICTCT Workshop, Olomouc, 26-27.10.2017 No. 11 P. Olszewski et al. 30th ICTCT Workshop, Olomouc, 26-27.10.2017 No. 12
Results of model estimation - 2 Extended Poisson model Conclusions • More variables were included in the Poisson model • Model Poisson 4 has the • The recommended accident prediction model is based on best fit parameters and Negative Binomial distribution: correct plot of cumulative residuals • Significant variables: • Risk factors affecting pedestrian safety at unsignalized DPV, DTV, HGV, HOUSE, PPEAK crossings: proportion of heavy vehicles, location in a housing • None of the other variables area, less peaked pedestrian volume profile were significant • Models developed will help to establish a relationship • Final equation for the number of accidents per year: between accident frequency and conflict frequency • Possible improvements: accounting for seasonal variability (DTV -> AADT) and daily variability (peak ratio) P. Olszewski et al. 30th ICTCT Workshop, Olomouc, 26-27.10.2017 No. 13 P. Olszewski et al. 30th ICTCT Workshop, Olomouc, 26-27.10.2017 No. 14 P. Olszewski et al. 30th ICTCT Workshop, Olomouc, 26-27.10.2017 No. 15 30th ICTCT Workshop, Olomouc, 26-27.10.2017 Thank you very much for your attention! This project has received funding from the European Union’s Horizon 2020 research and innovation programme under grant agreement No 635895
Recommend
More recommend