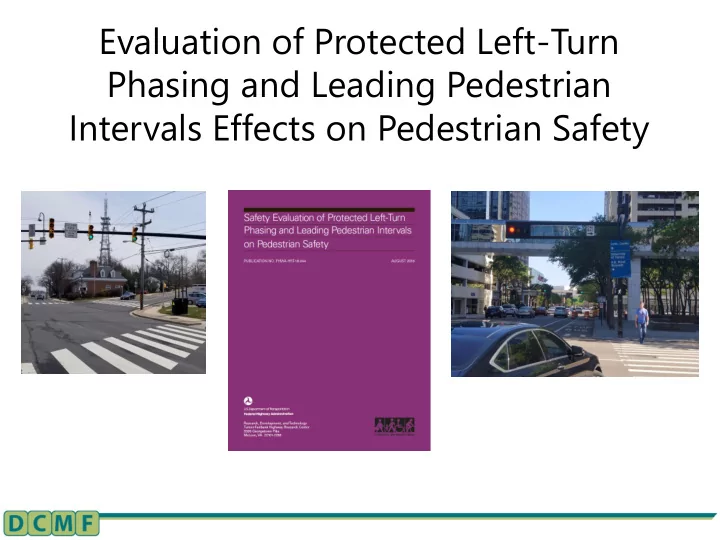

Evaluation of Protected Left-Turn Phasing and Leading Pedestrian Intervals Effects on Pedestrian Safety
Study Background ◼ VHB, UNC and Persaud and Lyon Inc. ◼ FHWA sponsored through DCMF pooled fund ◼ Goals are to develop CMFs ◼ Two treatments covered for signalized intersections • Adding protected-permissive or protected left-turn phasing • Adding leading pedestrian interval (LPI)
Previous Findings for Left-Turn Phasing ◼ 1 Hauer suggested a CMF of 0.3 for left-turn opposing crashes for adding protected phasing and no effect for other crash types ◼ 1 Hauer suggested a CMF of 1.0 (no effect) for changing from permissive to permissive-protected ◼ 2 Lyon et al. estimated a CMF of 0.88 and 0.75 for flashing advance green and LTGA for left-turn opposing crashes 1 Hauer, E. (2004). Left-Turn Protection, Safety, Delay and Guidelines: A Literature Review, ResearchGate, Berlin, Germany. Available online: https://www.researchgate.net/publication/280310470_Left_ _turn_protection._Safety._Literature_review_up_t0_2003, last accessed November 2017. 2 Lyon, C., Haq , A., Persaud, B., and Kodama, S. (2005). “Safety Performance Functions for Signalized Intersections in Large Urban Areas: Development and Application to Evaluation of Left- Turn Priority Treatment.” Transportation Research Record: Journal of the Transportation Research Board, 1908, pp. 165 – 171, Transportation Research Board, Washington, DC.
Previous Findings for Left-Turn Phasing ◼ 3 Srinivasan et al. found decreases in left-turn opposing (CMF 0.86) and increases in rear-ends (CMF 1.08) for a mix of permissive to protected-permissive or protected phashing ◼ 4 NY estimated a CMF of 0.52 for veh-ped crashes for a mix of permissive to protected-permissive or protected phasing 3 Srinivasan, R., Gross, F., Lyon, C., Persaud, B., Eccles, K., Hamidi, A., Baek, J., et al. (2011). Evaluation of Safety Strategies at Signalized Intersections, National Cooperative Highway Research Program Report 705, Appendices to Final Report, Transportation Research Board, Washington, DC. 4 Chen, L., Chen, C., Ewing, R., McKnight, C.E., Srinivasan, R., and Roe, M. (2013). “Safety Countermeasures and Crash Reduction in New York City: Experience and Lessons Learned.” Accident Analysis and Prevention, 50, pp. 312 – 322, Elsevier, Amsterdam, Netherlands.
Previous Findings for LPI ◼ 1 King found the crash rate of LPI sites to be 28% lower for veh-ped crashes ◼ 2 Fayish and Gross estimated a CMF of 0.61 for veh-ped crashes based on 10 sites 1 King, M.R. (2000). “Calming New York City Intersections,” Transportation Research E - Circular: Urban Street Symposium, Number E-C019, Transportation Research Board, Washington, DC. Available online: http://onlinepubs.trb.org/onlinepubs/circulars/ec019/Ec019_i3.pdf, last accessed June 28, 2018. 2 Fayish, A.C. and Gross, F. (2010). “Safety Effectiveness of Leading Pedestrian Intervals Evaluated by a Before –After Study With Comparison Groups.” Transportation Research Record: Journal of the Transportation Research Board, 2198, pp. 15 – 22, Transportation Research Board, Washington, DC.
Study Methodology ◼ empirical Bayes Before-after ◼ Uses Safety Performance Functions ◼ Analysis controls for three important confounding factors: • Regression-to-the-mean • Changes in traffic volumes • Time trends in crash counts unrelated to the treatment
Data ◼ Intersection geometry, traffic volumes, crash data, ped volumes ◼ Data for treated and reference sites ◼ Looked at veh-ped primarily but also veh-veh and veh-veh inj Evaluation City Treatment Reference Sites Sites Chicago 27 149 Left-Turn New York 7 146 Phasing City Toronto 114 776 Chicago 56 183 New York 42 157 LPI City Charlotte 7 111
Results for Left-Turn Phasing CMF for CMF for CMF for Vehicle – Vehicle – Pedestrian – City Treatment Sites Vehicle Vehicle Injury Vehicle Crashes Crashes (SE) Crashes (SE) (SE) 68 protected- 1.031 0.890 1.136 Chicago permissive, (0.040) (0.079) (0.146) 2 protected 1 protected- New York 0.672* 0.788 0.718 permissive, City (0.110) (0.153) (0.196) 8 protected 134 protected- 1.025 0.951* 1.106 Toronto permissive, (0.011) (0.020) (0.061) 2 protected 203 protected- All cities 1.023 0.942* 1.091 permissive, combined (0.016) (0.028) (0.066) 12 protected
Results for Left-Turn Phasing ◼ Disaggregate analysis undertaken ◼ No relationships between CMF and site characteristics found for veh-veh or veh-veh injury crashes ◼ For veh-ped some indications that CMF is lower at higher pedestrian volumes ◼ CMF = exp(1.4179)(PEDVOL) -0.1645 Where, PEDVOL = sum of 24 hr pedestrian counts for all legs ◼ CMFunction indicates a CMF less than 1.0 for PEDVOL >5,500
Results for LPI CMF for CMF for CMF for Total Treatment Total Vehicle – City Injury Crashes Sites Crashes Pedestrian (SE) (SE) Crashes (SE) 0.90* 0.83* 0.81* Chicago 56 (0.027) (0.046) (0.070) 0.84* 0.86* 0.91 New York City 42 (0.031) (0.037) (0.062) 0.90 1.09 0.54 Charlotte 7 (0.09) (0.18) (0.38) All cities 0.87* 0.86* 0.87* 105 combined (0.02) (0.03) (0.05)
Implications ◼ Dependable estimates of safety benefits are required to prioritize safety treatments ◼ Safety benefits can vary based on site characteristics ◼ A scientific approach to selecting locations is critical for success
Recommend
More recommend