
SLIDE 1
www.AJStein.de
Farming for fitness:
the economics of putting vitamins and minerals into staple crops Alexander J. Stein
5 May 2010, The University of Nottingham Plant and Crop Sciences Seminar
Slide 2
fitness fit·ness (fĭt'nĭs) n. The state or condition of being physically sound and healthy, especially as the result of exercise and proper nutrition. A state of general mental and physical well-being. ! This seminar is about the fitness of the poor and malnourished to simply live and work
Slide 3
Structure
- Introduction
- Vitamin and mineral deficiencies (VMDs)
- Health consequences of VMDs
- Quantifying the burden of disease of VMDs
- Socio-economic impacts of VMDs
- Causes of VMDs
- Micronutrient interventions
- Impact and cost-effectiveness of biofortification
- Conclusions
Slide 4
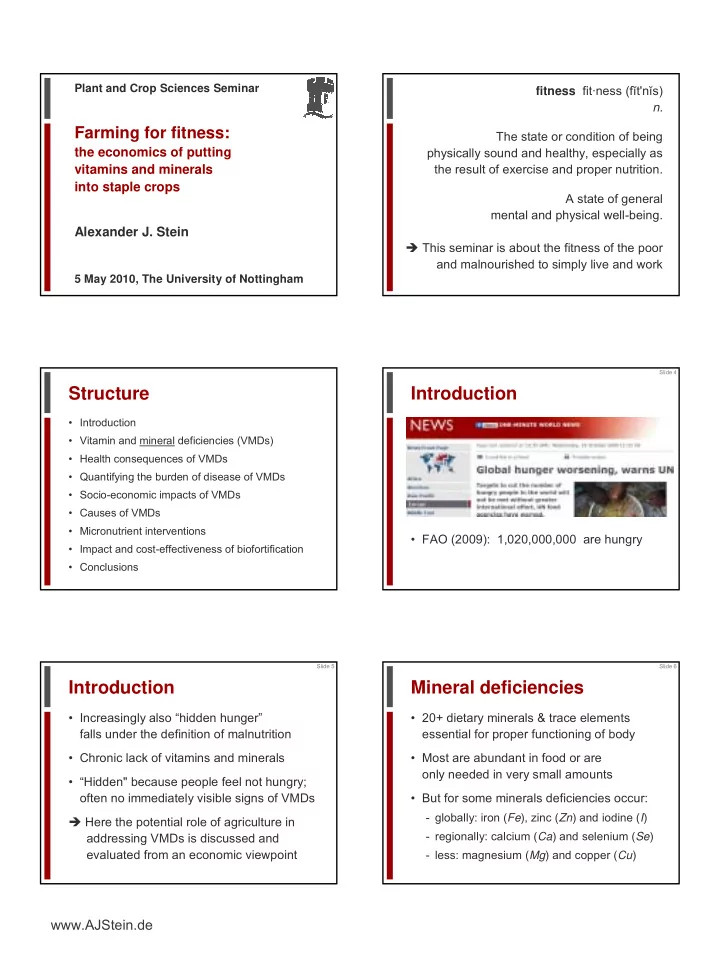
Introduction
- FAO (2009): 1,020,000,000 are hungry
Slide 5
Introduction
- Increasingly also “hidden hunger”
falls under the definition of malnutrition
- Chronic lack of vitamins and minerals
- “Hidden" because people feel not hungry;
- ften no immediately visible signs of VMDs
! Here the potential role of agriculture in addressing VMDs is discussed and evaluated from an economic viewpoint
Slide 6
- 20+ dietary minerals & trace elements
essential for proper functioning of body
- Most are abundant in food or are
- nly needed in very small amounts
- But for some minerals deficiencies occur:
- globally: iron (Fe), zinc (Zn) and iodine (I)
- regionally: calcium (Ca) and selenium (Se)
- less: magnesium (Mg) and copper (Cu)