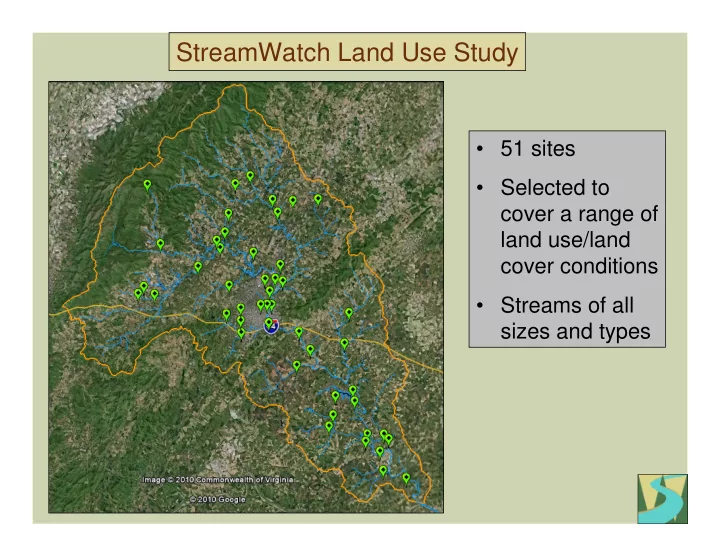
SLIDE 1 StreamWatch Land Use Study
cover a range of land use/land cover conditions
sizes and types
SLIDE 2 DATA Biological
- 2.5 years of bug sampling – spring 2007 through spring 2009
- Average of 6 bug samples per site
- Bacteria
Geomorphological
- Channel dimensions, slope
- Particle size (Wolman pebble count)
Local Habitat
- EPA rapid visual
- Streambed permeability
Watershed Land Use/Land Cover
- LU/LC classes: impervious, forest, open land, etc.
- Cattle population density
- Human population density
StreamWatch Land Use Study
SLIDE 3 StreamWatch Land Use Study
BUG DATA
- Similar to Virginia DEQ’s
Virginia Stream Condition Index
“Level III” data by DEQ
- 200 organisms per
- sample. Each organism
ID’d to family
at average index scores, average # of families, and assessed health.
SLIDE 4 StreamWatch Land Use Study
LAND USE/LAND COVER
- Impervious
- Forest (deciduous,
evergreen, plantation)
- Forest harvest
- Open land
- Orchard, vineyard,
golf course, bare soil
grazed pasture
SLIDE 5 Watershed class Number of watersheds Approximate %
area Average population density (per square mile) Average percent forest cover Average percent impervious cover Wild 2 1% 1 97% 0.6% Rural 26 14% 28 80% 1.0% Exurban 113 60% 86 71% 2.0% Suburban 39 21% 367 65% 5.6% Urban 9 5% 2,393 49% 25.0% Land use/land cover conditions in 189 small Rivanna subwatersheds classified according to population density.
SLIDE 6
Extirpation (local extinction) correlates with land use intensity
SLIDE 7
Center for Watershed Protection’s conceptual model
SLIDE 8
General relationship between health and IC
biological condition vs % impervious - 1st to 5th-order systems, not including sites near point sources (n=42) R2 = 0.82 10 20 30 40 50 60 70 80 90 0% 10% 20% 30% 40% 50% watershed % impervious average biological index score
SLIDE 9
Comparison of SW results with conceptual model
SLIDE 10
- Impervious cover is not the only important
watershed-scale factor.
- In rural, exurban, and suburban systems, forest
cover correlates with stream health as strongly as impervious cover.
- IC and FC covary only moderately, therefore
both factors should be considered when assessing risk of degradation in non-urban streams.
SLIDE 11
biological condition vs % impervious - 1st to 5th-order systems, not including sites near point sources (n=42) R2 = 0.82 10 20 30 40 50 60 70 80 90 0% 10% 20% 30% 40% 50% watershed % impervious average biological index score biological condition vs % impervious - 1st to 5th-order systems, not including sites near point sources (n=42) R2 = 0.82 10 20 30 40 50 60 70 80 90 0% 5% 10% 15% 20% watershed % impervious average biological index score
good fair poor
SLIDE 12 Urban (9) Suburban/mixed (11) Exurban/mixed (15) Rural or Wild (7)
Watershed type / number of cases
8.0 7.0 6.0 5.0 4.0 3.0 2.0
Assessed biological condition Virginia aquatic life standard
Very good or good Fair Poor
More than half of exurban streams did not meet the Virginia aquatic life standard.
SLIDE 13
Rivanna basin – predominately exurban
SLIDE 14 Cows
Cattle operations, quantified at the landscape scale, showed no distinctive significant relationship with stream biological condition. The analysis is confounded somewhat by cattle/deforestation
- covariance. Nevertheless,
cattle effects at the landscape scale seem to be
importance relative to impervious cover and deforestation.
SLIDE 15
Bank erosion and sediment
SLIDE 16
Riparian buffer Conditions in the riparian buffer zone correlate moderately with biological condition, and appear to mitigate landscape- scale effects to some extent.
SLIDE 17 Watershed stories
Albemarle County reference stream #2
- 0.7 square miles
- Class – reference
- Impervious - 1.0%
- Forest - 99%
- People/sq mile - 0
- Health - very good (76)
- Sensitive bugs - 12
SLIDE 18 Watershed stories
Buck Mountain Creek upper west of Rt 666
- 20.9 square miles
- Class - rural/exurban
- Impervious - 1.2%
- Forest - 82%
- People/sq mile – 50
- Health - very good (72)
- Sensitive bugs - 9
SLIDE 19 StreamWatch Land Use Study
Mechums River trib near Whipporwill Drive
- 0.5 square miles
- Class – suburban
- Impervious - 5.8%
- Forest - 89%
- People/sq mile - 340
- Health - good (66)
- Sensitive bugs - 9
SLIDE 20 Watershed stories
Town Creek @ Dunlora Drive
- 0.4 square miles
- Class – urban
- Impervious - 15.4%
- Forest - 48%
- People/sq mile – 1,200
- Health - fair (52)
- Sensitive bugs - 6
SLIDE 21 Watershed stories
Carroll Creek in Glenmore
- 5.8 square miles
- Class - suburban
- Impervious - 4.2%
- Forest - 66%
- People/sq mile - 262
- Health - poor (39)
- Sensitive bugs - 3
SLIDE 22 Watershed stories
Rivanna trib #2 in Woodbrook
- 0.5 square miles
- Class – urban
- Impervious - 43%
- Forest - 37%
- People/sq mile– 1,800
- Health - very poor (20)
- Sensitive bugs - 0
SLIDE 23
Urban Streams – 1 sensitive bug Suburban Streams – 5 sensitive bugs Exurban Streams – 7 sensitive bugs Rural Streams – 8 sensitive bugs Reference Streams – 11 sensitive bugs