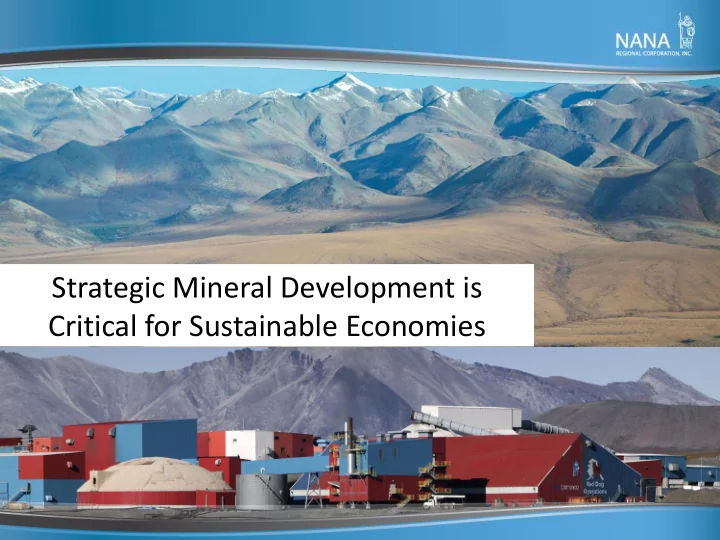

Strategic Mineral Development is Critical for Sustainable Economies
HR 4402 – passed 256-160 in July, 2012 Requires the Department of the Interior and the Department of Agriculture to more efficiently develop domestic sources of strategic and critical minerals and mineral materials; including rare earth elements . Defines strategic and critical minerals as those that are necessary: 1. For national defense and national security requirements; 2. For the Nation’s energy infrastructure including pipelines, refining capacity, electrical power generation and transmission, and renewable energy production; 3. To support domestic manufacturing, agriculture, housing, telecommunications, healthcare and transportation infrastructure; and 4. For the Nation’s economic security and balance of trade.
Strategic and Critical Minerals What are they? • Depends upon the Global situation – i.e. Salt (coins were made of salt) – China imposed a tax on Salt in 2200 B.C. • China had a monopoly; taxation of salt raised $$ for the empire • What are other drivers of mineral resource scarcity? – Population; developing countries are growing – Food security; Asian countries are investing around the world in arable land
2B people have risen out of poverty in Asia in the last 20 years = more consumption Developing countries – The world is becoming Asia centric UNEP
Food Security UNEP
B A S E M E T A L M A R K E T S – Z I N C Million tonnes China is the Driver for 6 Global Zinc USA Europe Consumption Japan China 5 Zinc Consumption ROW • Asia has been the leader in growth - 4 up 117% since 2000 3 • Within Asia, China has been the growth engine up 272% since 2000 2 • Since the Global Financial crisis, 1 consumption has rebounded from 2009 levels - up 7% in the Americas Source : ILZSG and 30% in Europe 0 00 01 02 03 04 05 06 07 08 09 10 11
China is the biggest consuming country globally and also the biggest in the largest end use category lead copper zinc 35% global share of 39% global share 39% global share wire rod production of lead battery of galvanized production sheet production Today China only galvanizes 4% of its crude steel, US galvanizes 18% of its crude steel Source: ILZSG, ICSG
China Global Share and rank (ILZSG,ICSG) 2001 2011 COPPER Mine 5% 10% #2 Refine 10% 26% #1 Consumption 16% 40% #1 LEAD Mine 20% 50% #1 Refine 18% 44% #1 Consumption 11% 45% #1 ZINC Mine 18% 33% #1 Refine 22% 40% #1 Consumption 17% 43% #1
China’s Resource Strategy Chinese Invest in countries Unknown ROI China has 26% of all companies have a with resources; metrics foreign owned US low cost of capital regardless of politics treasury securities and 8% of US public debut
China’s Resource Strategy a snapshot – Cu In 2006 China Yet China has 6% 25% of global Cu Wood Mackenzie consumed 23% of the worlds supply comes recognizes in 2000 62% of the worlds copper reserve. from; Indonesia, of Cu production came copper, 41% in Russia, from Low Risk Countries, 2010 and 55% by Kazakhstan, Iran by 2020 they estimate 2025. and the 44% will come from low Democratic risk countries – thus Republic of investing in higher risk Congo. countries is more likely.
China’s Resource Strategy a snapshot – Cu and Fe Purchases - 2012 Looking ahead CITIC’s iron project in Minmetals bought investment may not be western Australia Anvil Mining's copper as aggressive and will went from $2.5B deposit in the DRC have greater due- initially to $8.0B in for $1.3B. diligence. But who August 2012. knows?!
The opening (access) of the Arctic; has Alaska's ship come in? or is it someone else's?
We balance between development and maintaining our culture, subsistence and way of life.
Strategic Minerals – In Arctic Northwest Alaska US Foreign Dependence/China % of global consumption 73% (5% of global reserve)/ 43% 35% (5% of global reserve)/ 40% 90% / China accounts for 55% of global refinery production 75% (<1% of global reserve)/?? 18% (recycled lead is 91% of US consumption)/ 45% US imports basically all primary lead
NANA region projects Strategic Mineral Development = Sustainable Economy
4.4% (2010) of global zinc mine production 600 + Family- supporting jobs 73 % (2010) of US zinc mine production ~49% - 60%+ of ~25% of Alaska’s Alaska’s mineral export in 2010 was export in recent years due to Red Dog
Helping All of Alaska Doyon, Limited Koniag, Inc. Sealaska Corporation Calista Corporation $512 CIRI Aleut Corporation million Ahtna, Inc. Bristol Bay Native Corporation in total 7(i) Arctic Slope Regional Corporation payments since mining began through FY ‘12 Chugach Alaska Corporation Bering Straits Native Corporation
Upper Kobuk Mineral Project Nearly 50 years of on and off exploration for polymetallic deposits 15 years of community engagement and sporadic mineral exploration activity NANA - NovaCopper venture • 192 jobs in 2012 • Oversight Committee developed with NANA/NC • Can leverage infrastructure development to keep the cost of living down in the villages
Bornite Circa 1967-68
Bornite - August 2011
Ambler Mining District Access Project Study Area/Corridors AKDOT
Acce ccess ss – NW Alask ska AKDOT
Conclusions • Any minerals we are not self sufficient on are critical and strategic • The developing countries have a new mineral resource strategy – purchase a countries resource, don’t worry about the politics • The global focus on the Arctic puts Alaska on the radar for resource opportunities – we should seize it for sustainability! • It is Critical for the US and Alaska to be Strategic on mineral development
TAIKUU naturalresources@nana.com
Recommend
More recommend