
Spatially resolved spectroscopy of NGC 4945 Andrea Marinucci A. S. Bianchi, G. Fabbiano, G. Matt, G. Risaliti, E. Nardini, J. Wang The X-ray Universe 2017 – Rome, June 7 th 2017
Introduction NGC 4945 is a nearby (3.7 Mpc), almost edge-on, spiral galaxy. It is the brightest Sy 2 galaxy and the brightest radio-quiet AGN of the 100 keV sky after NGC 4151 (Done et al, 1996) Previous studies revealed the extreme absorbing column density of N H ~4 x 10 24 cm -2 in the source. It completely blocks the primary nuclear emission below 8-10 keV and the nucleus can only be directly seen in higher energy ranges (>10 keV). Guainazzi+00 Andrea Marinucci (Roma Tre) X-ray Universe 2017 1/10
Introduction NuSTAR observations confirmed the very variable intrinsic continuum of the source and a constant emission below 10 keV. Puccetti+14 Andrea Marinucci (Roma Tre) X-ray Universe 2017 2/10
Introduction 6.2-6.7 keV 2-10 keV Past imaging analysis with Chandra (~ 230 ks) revealed ~200 pc that the Iron K α and the associated Compton reflection continuum are spatially extended on scales of ~100 pc hundreds of parsecs. Marinucci+12 Comparing spectra taken with different instruments (and different extraction regions) on a time scale of ten years, the reprocessed emission is found constant within 4%. Andrea Marinucci (Roma Tre) X-ray Universe 2017 3/10
Introduction 6.2-6.7 keV 2-10 keV Past imaging analysis with Chandra (~ 230 ks) revealed ~200 pc that the Iron K α and the associated Compton reflection continuum are spatially extended on scales of ~100 pc hundreds of parsecs. Marinucci+12 Comparing spectra taken with different instruments (and different extraction regions) on a time scale of ten years, the reprocessed emission is found constant within 4%. Andrea Marinucci (Roma Tre) X-ray Universe 2017 3/10
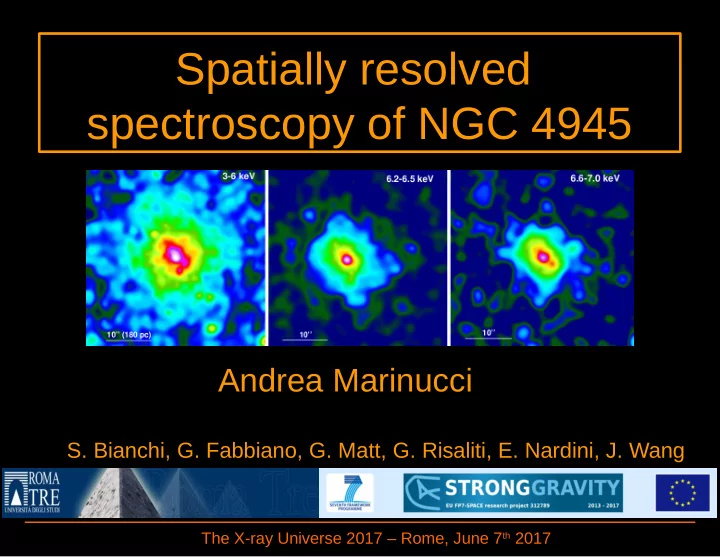
Imaging analysis When images in different energy bands are extracted from the combined event file, 420 ks long, a clump of ionized iron emerges on the south-west direction, 2.2'' (~40 pc) from the nucleus. Marinucci et al., submitted Andrea Marinucci (Roma Tre) X-ray Universe 2017 4/10
Imaging analysis The ratios between the three images are proxies of the EW of the lines and can be helpful in choosing extraction regions. Andrea Marinucci (Roma Tre) X-ray Universe 2017 5/10
Imaging analysis The ratios between the three images are proxies of the EW of the lines and can be helpful in choosing extraction regions. Andrea Marinucci (Roma Tre) X-ray Universe 2017 5/10
Imaging analysis The ratios between the three images are proxies of the EW of the lines and can be helpful in choosing extraction regions. The unresolved, nuclear emission confirms to remain constant throughout the 13 years of monitoring. The Equivalent Width of the neutral Fe K α emission line is 2.7 ± 0.5 keV. Andrea Marinucci (Roma Tre) X-ray Universe 2017 5/10
Spectral analysis Andrea Marinucci (Roma Tre) X-ray Universe 2017 6/10
Spectral analysis Andrea Marinucci (Roma Tre) X-ray Universe 2017 6/10
The variable Fe K α EW The Fe Kα EW, depends on the Fe abundance (Matt et al, 1997), on the angle θ i between the polar direction and the line of sight (Matt et al., 1991; George & Fabian, 1991) and on the column density of the illuminated material (Yaqoob et al. 2010, Matt 2002). We therefore used different models to retrieve the observed EWs of the Fe Ka in the nuclear region (2.7 ± 0.5 keV) and in region 2 (0.65 ± 0.30 keV). Pexmon MYtorus A fe (Nucleus)=3.2 ± 0 . 4 A fe (Region 2)=0.8 ± 0 . 5 Andrea Marinucci (Roma Tre) X-ray Universe 2017 7/10
The Fe XXV K α clump (a.k.a. region 1) The energy centroid of the Fe xxv Kα, even though consistent with the resonant line at the 90% confidence level, suggests the predominance of the forbidden line within the triplet. We can use these results to provide estimates on the gas parameters, such as its column density, the Fe abundance and the ionization state. With the CLOUDY code we are able to model the spectrum from region 1 in terms of a self-consistent photoionization model and retrieve the best-fit parameters : logU=2.2 ± 0 . 3 logN H >23.5 A fe >3 Using the inferred ionization parameter, the SED and L 2-10 of NGC 4945, at a distance d=40 pc the clump has a density n cl =10 2 cm -3 . Andrea Marinucci (Roma Tre) X-ray Universe 2017 8/10
The Chandra view of nearby CT sources Circinus Mrk 3 =19 pc Guainazzi+12 1''=270 pc Marinucci+13 NGC 1068 ESO 428-G014 1''=112 pc 1''=110 pc Fabbiano+17 Young+01 Andrea Marinucci (Roma Tre) X-ray Universe 2017 9/10
Conclusions The additional 200 ks of data on NGC 4945 allowed us to study the extended Iron K a emission and associated reflection continuum with much greater detail: the equivalent width of the Iron K a line is found to be spatially variable a highly ionized Iron emission in a very confined region, about 40 pc distant from the nucleus, has been detected and spectrally characterised Our findings support a physical environment around the nucleus which is not homogeneously distributed: the gas responsible for the reprocessing of the nuclear radiation is clumpy and extended around the central region, on scales of hundreds of parsecs. Andrea Marinucci (Roma Tre) X-ray Universe 2017 10/10
Backup slides - 1 Red=0.3-2.0 keV Green=2-10 keV • Extraction regions: 1) 2) 1.5” Nucleus 3) 12”x 6” Box 4) 2) – 1) AM et al, 2012 5) Soft emission cone 6) Andrea Marinucci (Roma Tre) X-ray Universe 2017
Backup slides - 2 Andrea Marinucci (Roma Tre) X-ray Universe 2017
Backup slides - 3 Andrea Marinucci (Roma Tre) X-ray Universe 2017
Recommend
More recommend