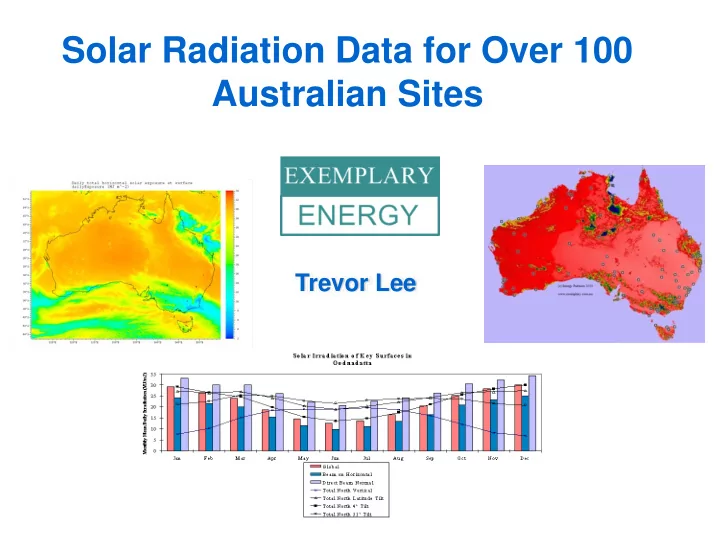

Solar Radiation Data for Over 100 Australian Sites Trevor Lee
Timeline 1974 Spencer Tables Spencer 1976 Pioneering work of Paltridge and Proctor 1988 First Edition: Australian Solar Radiation Data Handbook (ASRDH) Frick et al 1991 Major error in was first revealed by Lee 1992 Second Edition: Corrected Version of the ASRDH 1995 Third Edition of the ASRDH 2006 Fourth Edition of the ASRDH 2012 Fifth Edition of the ASRDH
Data Source Australian Government – Bureau of Meteorology – BOM American Society of Heating, Refrigerating and Air-Conditioning Engineers, ASHRAE
Data Source BOM Australia divided into a Grid with intervals � 0.05 degrees Latitude � 0.05 degrees Longitude � Almost 280,000 pixels � Approximately 5km X 5 km each Data � 1998 – mid 2001 � mid 2003 – 2010 Hourly GHI + DNI � Global Horizontal Irradiance W/m 2 � Direct Normal Irradiance W/m 2
Data Source ASHRAE � Selected from 268 sites in Australia � Monthly Data � Clear Sky Values of radiation � Interpolation method relies on ASHRAE data
BCA – Geographic Coverage
Geographic Coverage – New Zealand
ASRDH Version 4 – Geographic Coverage Legend for Location (listed in descending order of accuracy): Red G&D Locations using both global and diffuse measurements Orange G Locations using global radiation measurements only, with the diffuse radiation estimated. Blue EST Locations using only estimated data from cloud cover records
Radiation Network Status 2008
ASRDH Version 5 – Geographic Coverage Geographic Spread of 99 Sites of the ASRDH Edition 5 plus Willis Island (overlayed on a sample single-hour image from the Exemplary ASEA comprising nearly 280,000 pixels with individual values estimated from satellite observations)
ASRDH Version 5 – Geographic Coverage Geographic Spread of the 20 extra ASRDH Edition 5 sites (extra in addition to the 80 Sites of the ACDB 2008) (overlayed on a sample single-hour image from the Exemplary ASEA comprising nearly 280,000 pixels with individual values estimated from satellite observations)
Additional Tables Average Clear Sky � Clearness Index � Direct and Global hourly and daily irradiance on a horizontal plane � Total Hourly and Daily irradiance on a North facing plane inclined at latitude angle for each month � Total Hourly and Daily Irradiance on a North, East, South, and West facing Vertical Plane Solar Angles � Azimuth � Altitude
AuSolRad Version 3 User selects : � Orientation in 1 ° increments � Tilt in 1 ° increments (including facing down) � Depth of overhang � Reflectivity of the “ground” AUSOLRAD produces: � Tables for all geometries of engineering and architectural interest including single and double axis tracking
ASRDH - Sample Graphical Summary Hobart as a Sample of the Spatial Variation Mapped for Capital Cities
ASRDH - Sample Graphical Summary Hobart as a Sample of the Spatial Variation Mapped for Capital Cities Seasonal Variation
ASRDH - Sample Graphical Summary Geographic Spread of the 28 Sites of the ASRDH Edition 4 (overlayed on a sample single-hour image from the Exemplary ASEA comprising nearly 280,000 pixels with individual values estimated from satellite observations)
Exemplary ASEA The Exemplary Australian Solar Energy Atlas (EASEA, inhouse Exemplary Energy software) was developed to visualise the GHI+DNI data on a PC screen, without an expensive GIS system Challenge : • To creating hourly data on the hour, as the locations are read at different times within the hour • Interpolating the data minute by minute is utilised
Exemplary ASEA - Sample Graphical
Quality Assurance � Minute-by-minute interpolation � ACDB or TMY accumulation � Cap values at 110% Clear Sky � Cap DNI at DHI = 90% GHI � Compare with BOM and other reliable ground stations � Select nearby “pixel” when >50% sea
Detailed Comparisons - Beam
Detailed Comparisons – Diffuse
Conclusions � Solar and Coincident Weather Data for almost anywhere in Australia � Can target Large Scale Solar Deployment � Reduces uncertainty in the peak and average output � Key sites for publication � Real time data series � Exemplary Australian Solar Energy Atlas
Solar and Coincident Weather Data for Trevor Lee Large Scale Solar Deployment Questions?
Climate Data for Renewable Energy and Energy Conservation Applications The Australian Solar and Climate Resource � Australian Solar Radiation Data Handbook background and applications Beyond TMY: Climate Data for Specific Applications Australian Climate Data Bank and using Reference Meteorological Years � Creation of Ersatz Future Weather Data Files � Measuring energy performance of buildings under predicted future weather conditions
Associated Papers � CREATION OF ERSATZ FUTURE WEATHER DATA FILES (Solar 08) – Trevor Lee and David Ferrari – Energy Partners, Master Builders Centre, 1 Iron Knob Street, Fyshwick PO Box 1211, ACT 2609, Australia � AUSTRALASIAN SOLAR RADIATION DATA PROPOSAL FOR ENHANCED KNOWLEDGE DISSEMINATION (Solar 08) – Trevor Lee – Energy Partners, Master Builders Centre, 1 Iron Knob Street, Fyshwick PO Box 1211, ACT 2609, Australia � THE AUSTRALIAN CLIMATIC DATA BANK (Solar 06) – Trevor Lee and Mark Snow – Energy Partners, Master Builders Centre, 1 Iron Knob Street, Fyshwick PO Box 1211, ACT 2609, Australia � DEVELOPMENT OF CLIMATE DATA FOR BUILDING RELATED ENERGY RATING SOFTWARE (Solar 05) – Barbara Ridley and John Boland – Centre for Industrial and Applicable Mathematics University of South Australia Mawson Lakes Boulevard, Mawson Lakes SA 5095, Australia
Recommend
More recommend