Software Metrics Overview SE 350 Software Process & Product - PowerPoint PPT Presentation
Software Metrics Overview SE 350 Software Process & Product Quality Lecture Objectives Provide a survey of common software metrics Product metrics Project (process) metrics Use of product and project metrics in- process and
Software Metrics Overview SE 350 Software Process & Product Quality
Lecture Objectives Provide a survey of common software metrics Product metrics Project (process) metrics Use of product and project metrics in- process and “post mortem” for process and product improvement Begin to ask questions about metrics validity and interpretation Get a feel for how the metrics might be used as indicators of quality Get a feel for challenges of interpreting quality from the metrics SE 350 Software Process & Product Quality
Measurements & Metrics Measurements: Raw numbers Metrics: (Usually) derived/computed numbers that: Indicate the extent to which some objective is being achieved Facilitate cross-comparison Can serve as the basis for actions to improve achievement of the objective Identifying useful metrics is hard work! Many times, we can’t find any for some objectives If so, use subjective evaluations SE 350 Software Process & Product Quality
Some Measurements for Software Size: Lines of code, function points Time and effort for different project activities Defects found, classified by phase occurred, phase found, module, type, severity Failures and when they occurred Staffing, requirements changes, customer satisfaction (survey results), etc. SE 350 Software Process & Product Quality
Metrics for Software Product Metrics Indicate the quality of the product produced Project Metrics Indicate whether process execution (business aspects) are on track In-Process Metrics “Barometers” to indicate whether the process appears to be “working normally” Allows making changes while there is still a chance to have an impact on the project Useful during the development and maintenance process to identify problems and areas for improvement SE 350 Software Process & Product Quality
Software Metrics – Things to Consider As you see each metric, think about: How useful is it? How would this be used? How meaningful is it? How easy is it to gather? How much extra work is it for developers to generate the numbers? Are there ways to “beat / defeat” this metric? Can you “make it look good” in ways that don’t achieve the objectives? What other metrics do you need to get a balanced picture? SE 350 Software Process & Product Quality
Product Metrics Performance Lots of measurements, lack of good metrics Reliability Defect density: Defects per KLOC (“1000 lines of code”) Failure intensity: Number of failures per (hour of) operation Availability Uptime % SE 350 Software Process & Product Quality
Product Metrics - Continued Usability SUMI score: user survey results, relative to “state -of- the- art” Evolvability, safety, security Metrics are more like measurements, value as indicators debatable Overall Customer satisfaction: results of customer surveys Customer reported defects: defect reports per customer- month SE 350 Software Process & Product Quality
Project Metrics Cycletime Elapsed time from requirements to delivery Productivity Size of delivered software / total effort Rate of Requirements Change % of requirements that changed plotted vs. time High requirements change will affect estimation accuracy, cycletime, quality SE 350 Software Process & Product Quality
Project Metrics - Continued Estimation Accuracy % difference between estimated and actual Can be done for cycletime (completion date), effort Staffing Change Pattern % of turnover (entered, left) plotted vs. time High staffing change will impact productivity, quality Cost, Scope, Risk These are often the most focused on by management Usually the focus of the Project Manager SE 350 Software Process & Product Quality
In-Process Metrics Tracking metrics during a project (“in - process”) provides a powerful monitoring and control tool Ensure that quality is in control React quickly to understand and respond to observed variations SE 350 Software Process & Product Quality
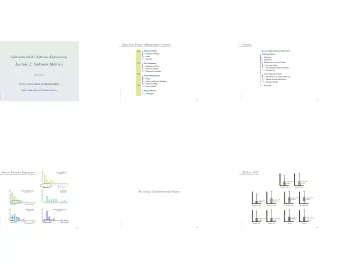
In-Process Metrics: Defects, Reliability Reliability growth pattern Failures during system testing plotted vs. time Expected: spikes during each release, decrease over time Magnitude of spike related to significance, volume of changes Pattern of defects found (arrivals) during testing Test defects found plotted vs. time during testing Should decrease significantly close to release Can project “latent defects” (defects left at release) from this Defect density Defects per KLOC (can be classified by type, module) Highlights “hot spots” Post-release defect density Strong indicator of effectiveness of testing SE 350 Software Process & Product Quality
In-Process Metrics: Maintenance Backlog Management Index Problems Closed / Problem Arrivals Should be close to 1, at least for high severity Responsiveness of fixing Average closure time, age of open & closed problems, % late fixes Should stay within target values Fix quality Number and % of defective fixes (didn’t work or created new bugs) Percent Delinquent Fixes # Fixes That Took Too Long / Number Fixes Delivered This is your SLA – Important to management, especially on the customer side. SE 350 Software Process & Product Quality
In-Process Metrics: Management Cost of Quality (CoQ) Total effort on quality assurance activities: testing, reviews, procedures Should be as low as possible – high may indicate “perfectionism” Cost of Poor Quality (CoPQ) Total effort expended on rework Should be within range (what if it is “too low” -- isn’t that great?) SE 350 Software Process & Product Quality
In-Process Metrics: Management (Continued) Phase containment effectiveness / defect removal effectiveness What % of the errors were detected within that phase? Shows effectiveness of reviews and other quality procedures Preferably around 70% or so If it is 97%, is that good? Note: Containment effectiveness can also be applied to incremental development Increment containment effectiveness SE 350 Software Process & Product Quality
DRE Table Example Phase of Origin Req Des Code UT IT ST Field Total Cum. Found Found Req 5 5 5 Des 2 14 16 21 Phase Found Phase Found Code 3 9 49 61 82 UT 0 2 22 8 32 114 IT 0 3 5 0 5 13 127 ST 1 3 16 0 0 1 21 148 Field 4 7 6 0 0 0 1 18 166 Total 15 38 98 8 5 1 1 166 Injected Cum. 15 53 151 159 164 165 166 Injected (Illustrative example, not real data) Phase of Origin SE 350 Software Process & Product Quality 16
Conclusion There are a number of metrics that can give a meaningful picture of what is going on in a project There are metrics that can help to identify problems and areas of improvement (in-process and post-mortem), as well as metrics that evaluate results We need to think carefully about what the metrics indicate about the process and product quality By designing a quality program that uses multiple metrics in conjunction with each other, we can get a balanced picture Most of the metrics come from relatively little raw measurement data: size, effort, defects / failures, timeline data Metrics that are important to the development team may not be the same as those important to the Project Manager, Management, or the Customer SE 350 Software Process & Product Quality
Recommend


More recommend
Explore More Topics
Stay informed with curated content and fresh updates.