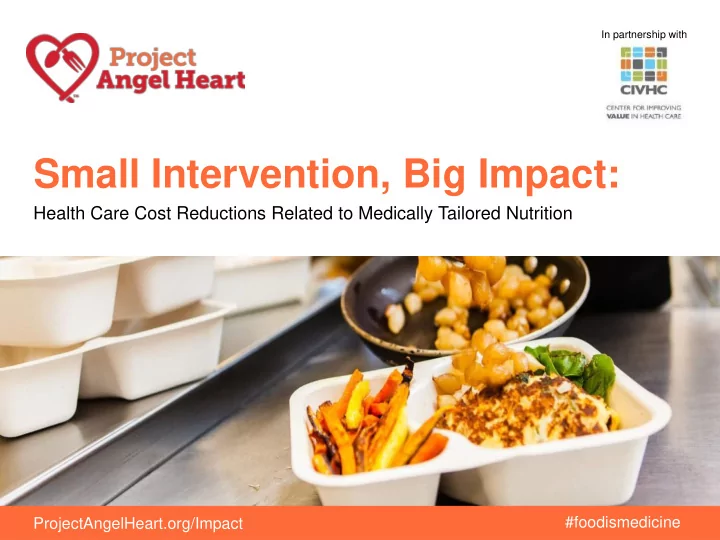

In partnership with Small Intervention, Big Impact: Health Care Cost Reductions Related to Medically Tailored Nutrition #foodismedicine ProjectAngelHeart.org/Impact
Rachael Raab, MPA Director of Strategic Partnerships rraab@projectangelheart.org #foodismedicine ProjectAngelHeart.org/Impact
Preparing and delivering medically tailored meals since 1991 #foodismedicine ProjectAngelHeart.org/Impact
Nutrition impacts health…but what about costs? • 68% report improved adherence to their health plan • 70% report better able to afford their basic needs • 67% report able to remain independent in their home • 73% report improved quality of life #foodismedicine ProjectAngelHeart.org/Impact
From there to here… • How can we quantify the impact of medically tailored meals? • How to fund a large- scale study? … with the right partners • CIVHC • Scholarship funding to access APCD • & many others!
Does providing medically tailored meals impact health care costs for chronically ill individuals? #foodismedicine ProjectAngelHeart.org/Impact
Do chronically ill individuals who receive medically tailored meals have lower health care costs than those who do not receive meals? #foodismedicine ProjectAngelHeart.org/Impact
Methodology: Definitions • Pre-intervention period - 6 months prior to start date of intervention • Intervention period - defined by service dates provided by PAH. – Service breaks < 30 days breaks were considered continuous service, breaks >2 months and < 5 months were removed from the analysis. Breaks of >6 months were considered a new service period. • Post-intervention period - 6 months after the service end date, no later than12/31/2013.
Methodology: Cohort Parameters To be included in the analysis, clients had to: • Be matched to claims in the CO All Payer Claims Database. • Have non-zero dollar claims for >50% of each period (pre-, post-, or intervention). • Be eligible for coverage for > 1 month of each period (pre-, post-, or intervention). • Have both a start and end date for services. • Have >3 weeks and < 2 years of service. • If deceased, have a single resolvable death date. Resulting in 708 total included clients
Methodology: Assumptions • Line of Business or type of insurance was determined by the type of coverage on the first day of service. • Age was determined at the start of the intervention period. • Primary disease was determined by the client at enrollment, not the claims. • Cost inflation was not taken into account. Note: PAH services are frequently initiated at or an acute exacerbation for many clients. This may have increased the pre-intervention costs for the intervention group over what clients’ “typical” costs would have been.
Methodology: Analysis • Client information was stripped from the data. • Claims for each client were analyzed by interval for utilization and cost. • Findings were summed by Line of Business and by primary disease. • Findings were reported by disease, line of business, and service line (inpatient, outpatient, professional, emergency department, and pharmacy). • Findings were compared pre-period to intervention period, and pre-period to post-period to determine significance.
Overall trend toward decreased health care cots #foodismedicine ProjectAngelHeart.org/Impact
Decreased total medical costs for meal recipients on Medicare #foodismedicine ProjectAngelHeart.org/Impact
13% decrease in rate of 30-day, all-cause readmissions #foodismedicine ProjectAngelHeart.org/Impact
Significant cost reductions for CHF, COPD, diabetes #foodismedicine ProjectAngelHeart.org/Impact
CHF – All payers $3,000.00 $2,836.49 $2,500.00 Cost per Person per 30 Days $2,110.68 $2,100.97 $2,000.00 $1,500.00 $1,000.00 $500.00 Lower $- Better Costs Pre Intervention Post Care p-value Pre to Intervention 0.0000 Pre to Post 0.0002
COPD – All payers $2,500.00 $2,218.79 $2,182.02 Costs per Person per 30 Days $2,000.00 $1,803.23 $1,500.00 $1,000.00 $500.00 $- Lower Better Pre Intervention Post Costs Care p-value Pre to Intervention 0.0037 Pre to Post 0.4282
Diabetes – All payers $1,800.00 $1,690.11 $1,600.00 Costs per Person per 30 Days $1,374.31 $1,400.00 $1,236.79 $1,200.00 $1,000.00 $800.00 $600.00 $400.00 $200.00 $- Lower Better Pre Intervention Post Costs Care p-value Pre to Intervention 0.0021 Pre to Post 0.0279
HIV - Medicaid $1,200.00 $959.56 $1,000.00 $873.41 Cost per Person per 30 Days $800.00 $618.21 $600.00 $400.00 $200.00 Lower $- Better Pre Intervention Post Costs Care p-value Pre to Intervention 0.2971 Pre to Post 0.0380
Next Steps Integrate HDM into health care delivery & payment models Capitalize on CMS supplemental benefits ruling for Medicare Advantage plans Broaden HDM benefits in CO Medicaid HCBS waivers
Study limitations • Primary disease was identified by client, not by claims. • No controlling for severity of primary disease or comorbidities. – This poses a significant issue for cancer analyses. • Most clients had at least some $0 claims, which change the cost and utilization interpretation. – All majority $0 cost claims were eliminated. • No mechanism for verifying meal consumption. • No tracking of over the counter or cash pay expenses. Lower Better Costs • We did not adjust for cost inflation over the course of Care the study.
Next Steps This study represents a critical first step in defining the financial return on investment from providing medically tailored meals to the chronically ill. • Next steps could include: – Detailed analysis of impact on cancers. – Detailed analysis of ESRD patients across payers. – Confirmation of client identified primary disease, and identification of comorbidity severity. – In depth analysis of the types of diets provided. Lower Better Costs Care – Prospective analysis to allow for increased information around adherence and to incorporate patient outcomes.
Recommend
More recommend