Six Month Report 2010 Hospital NKS, Stockholm KKH, Malm - PowerPoint PPT Presentation
Six Month Report 2010 Hospital NKS, Stockholm KKH, Malm Antofagasta highway, Chile 1 July 23, 2010 Skanska Six Month Report 2010 January June 2010 in brief Revenue for the Group SEK 56.3 bn (65.0) Revenue in Construction SEK
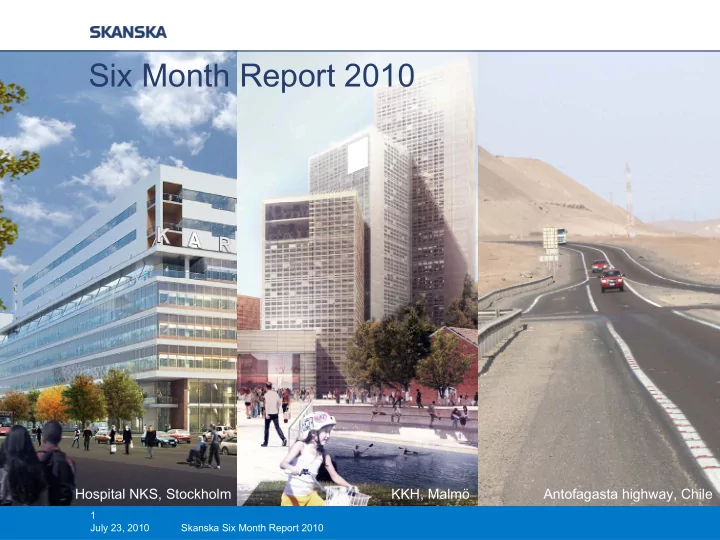
Six Month Report 2010 Hospital NKS, Stockholm KKH, Malmö Antofagasta highway, Chile 1 July 23, 2010 Skanska Six Month Report 2010
January − June 2010 in brief − Revenue for the Group SEK 56.3 bn (65.0) − Revenue in Construction SEK 51.8 bn (64.5) − Down 15 percent in local currencies − Operating margin in construction improved to 3.3 (3.2) percent − Operating cash flow increased to SEK 1.4 bn (0.9) − Interest-bearing net receivables amounted to SEK 6.1 bn − Order bookings increased by 17 percent to SEK 72.5bn (61.7) − Up 23 percent in local currencies − Book-to-build (rolling 12 month) 119% (76%) − Backlog of SEK 160.4 bn represents 16 months of construction − Operating income of SEK 2.4 bn (2.0) − Gains from divestment of properties SEK 0.4 bn (0.3) − Gains from divestment of ID assets SEK 0.2 bn (0.0) 2 July 23, 2010 Skanska Six Month Report 2010
Construction − Strong order bookings − Book to build 119% − Good earnings + Sweden, U.S., Poland − Norway, Finland − Revenue will bottom out 2010 Marriott Courtyard Hotel, Stockholm 3 July 23, 2010 Skanska Six Month Report 2010
New orders in Construction in Q2 − Total Bookings of SEK 46.9 bn − New Karolinska Solna, hospital, Sweden, SEK 14.5 bn − Antofagasta, highway, Chile, SEK 1.8 bn − Statoil Office, Norway, SEK 1.6 bn − Congress, concert hall and hotel facility, Malmö, Sweden, SEK 1.4 bn − Prison, U.K., SEK 1.2 bn − Essex Schools, U.K., SEK 0.8 bn − Highway viaduct in Seattle, U.S., SEK 0.8 bn 4 July 23, 2010 Skanska Six Month Report 2010
Residential Development − Good earnings in all markets − Good of new starts − Focus on new projects − Czech improved but Slovakia still slow market Iskristallen, Stockholm Silverdal, Stockholm 5 July 23, 2010 Skanska Six Month Report 2010
Commercial Development − Divestments − SEK 0.8 bn − Gain SEK 203 M − Three new projects started in Q2 − Investment value SEK 0.7 bn − Good interest from investors Grunwaldski Center, Wroc ł aw 6 July 23, 2010 Skanska Six Month Report 2010
Infrastructure Development − Financial close − New Karolinska Solna, hospital, Sweden − Essex Schools, U.K. − Concession agreement for Antofagasta highway Chile Schools for the Future, U.K. 7 July 23, 2010 Skanska Six Month Report 2010
Order situation – Construction Jan–Jun Jan–Jun Jul 2009– Jan–Dec SEK bn 2010 2009 Jun 2010 2009 51.8 64.5 117.7 130.4 Revenue 72.5 61.7 139.6 128.8 Order bookings 160.4 144.0 136.5 Order backlog 99% Book-to-build ratio 119% 175.0 150.0 125.0 100.0 75.0 50.0 25.0 0.0 Q2 08 Q3 08 Q4 08 Q1 09 Q2 09 Q3 09 Q4 09 Q1 10 Q2 10 Order backlog Order bookings per quarter Order bookings, rolling 12 month basis Revenue, rolling 12 month basis 8 July 23, 2010 Skanska Six Month Report 2010
Order bookings – Construction Book Jan–Jun Jan–Jun to build, SEK bn 2010 2009 R-12 Sweden 23.9 11.4 154% Norway 6.7 3.9 130% Finland 4.8 2.9 125% Poland 3.0 2.8 170% Czech Republic 2.4 4.6 63% UK 10.8 15.1 101% USA Building 11.2 17.0 95% USA Civil 4.3 1.9 113% Latin America 5.4 2.4 102% Total 72.5 61.7 119% 9 July 23, 2010 Skanska Six Month Report 2010
Construction Income statement Jan–Jun Jan–Jun Jul 2009– Jan–Dec 2010 2009 Jun 2010 2009 SEK bn Revenue 51.8 64.5 117.8 130.4 Gross income 4.5 5.3 10.3 11.2 Selling and administrative expenses -2.8 -3.3 -5.8 -6.3 Operating income 1.7 2.1 4.5 4.9 Gross margin, % 8.6 8.3 8.8 8.6 Selling and admin. expenses, % -5.4 -5.1 -4.9 -4.8 Operating margin, % 3.3 3.2 3.8 3.7 10 July 23, 2010 Skanska Six Month Report 2010
Construction Operating income Operating margin SEK M % Jan–Jun Jan–Jun Jan–Jun Jan–Jun 2010 2009 2010 2009 Sweden 427 556 4.1 4.4 Norway 192 211 3.6 3.6 Finland -31 86 neg 2.5 Poland 163 100 5.4 4.8 Czech Republic 96 177 2.9 3.5 UK 174 181 2.4 1.9 USA Building 176 257 1.6 1.5 USA Civil 484 425 8.2 6.5 Latin America 12 84 0.5 3.0 Total 1,693 2,077 3.3 3.2 11 July 23, 2010 Skanska Six Month Report 2010
Residential Development Income statement, segment reporting Jan–Jun Jan–Jun Jul 2009– Jan–Dec SEK M 2010 2009 Jun 2010 2009 Revenue 3,694 2,937 7,301 6,544 Gross income 527 179 926 578 Selling and administrative expenses -250 -295 -545 -590 Income from joint ventures and associated companies 54 -6 56 -4 331 -122 437 -16 Operating income Gross margin, % 14.3 6.1 12.7 8.8 S & A, % -6.8 -10.0 -7.5 -9.0 Operating margin, % 9.0 neg 6.0 neg 12 July 23, 2010 Skanska Six Month Report 2010
Residential Development Segment reporting Operating income 1 Operating margin 1 SEK M % Jan–Jun Jan–Jun Jan–Jun Jan–Jun 2010 2009 2010 2009 Sweden 143 17 9.2 1.1 Norway 34 -29 5.5 neg Denmark - -17 - neg Finland 127 -81 10.3 neg Nordics 304 -110 8.9 neg 27 -12 9.8 neg Czech Republic Total 331 -122 9.0 neg 1 Development gain only. Construction margin reported under Construction. 13 July 23, 2010 Skanska Six Month Report 2010
Residential Development June 30, 2010 Units under Of which Completed construction sold, % unsold units Q2, 2010 Q1, 2010 Q2, 2010 Q1, 2010 Q2, 2010 Q1, 2010 Sweden 1,843 1,672 70 68 39 54 Norway 306 201 63 66 1 2 Finland incl. Estonia 828 463 69 71 75 126 Nordics 2,977 2,336 69 68 115 182 Czech Republic 400 463 49 55 228 229 TOTAL 3,377 2,799 67 66 343 411 14 July 23, 2010 Skanska Six Month Report 2010
Residential Development Started units Sold units Jan–Jun Jan–Jun Jul 2009– Jan–Dec Jan–Jun Jan–Jun Jul 2009– Jan–Dec 2010 2009 Jun 2010 2009 2010 2009 Jun 2010 2009 Sweden 773 241 1,050 518 586 530 1,200 1,144 180 0 323 143 155 99 265 209 Norway Finland incl. Estonia 687 0 715 28 594 345 1,019 770 1,640 241 2,088 689 1,335 974 2,484 2,123 Nordics Czech Republic 274 121 274 121 206 138 337 269 1,914 362 2,362 810 1,541 1,112 2,821 2,392 TOTAL 15 July 23, 2010 Skanska Six Month Report 2010
Residential Development Number of unsold units 3,000 2,500 2,000 1,500 1,000 500 0 2003 2004 2005 2005 2005 2005 2006 2006 2006 2006 2007 2007 2007 2007 2008 2008 2008 2008 2009 2009 2009 2009 2010 2010 Dec Dec Mars June Sept Dec Mars June Sept Dec Mars June Sept Dec Mars Juni Sept Dec Mars June Sept Dec Mar June Completed unsold incl. reserv. Ongoing unsold incl. reserv. 16 July 23, 2010 Skanska Six Month Report 2010
Commercial Development Income statement, segment reporting Jan–Jun Jan–Jun Jul 2009– Jan–Dec 2010 2009 Jun 2010 2009 SEK M 2,738 1,342 5,942 4,546 Revenue 633 420 1,327 1,114 Gross income -179 -158 -355 -334 Selling and administrative expenses 0 -1 1 0 Income from J/V and assoc. companies 454 261 973 780 Operating income of which gain from divestments of 377 270 861 754 properties 1 of which writedowns/reversal of 0 0 -61 -79 writedowns 1 Additional gain included in eliminations was 60 28 105 73 17 July 23, 2010 Skanska Six Month Report 2010
Sale of commercial properties, Q2 2010 SEK M Sales price Capital gain Q1 1,574 234 Q2 796 203 Total 2,370 437 − Earlier eliminated construction profits, SEK 60 M included − Divestments in Q2 − Grunwaldzki Center, Wroclaw Poland − SEK 735 M; gain SEK 120 M − Divestments in Q3 − Land and development project for SÄPO, Solna, Sweden − Office building, Hjälmarekajen, Malmö Sweden − SEK 400 M; gain SEK 120 M 18 July 23, 2010 Skanska Six Month Report 2010
Commercial Development Specification of projects Carrying Carrying Occupancy Degree of amount, end amount, upon Market rate, completion, SEK bn of period completion value % % Completed projects 5.5 5.5 7.1 92 100 Undeveloped land and development properties 3.2 3.2 3.7 Subtotal 8.7 8.7 10.8 Ongoing projects 2.9 5.2 6.2¹ 70 58 Total 11.6 13.8 17.0 of which ongoing projects sold 1.7 2.0 2.4 according to segment reporting 1 Estimated market value at completion − Three new projects started in Q2 − New leases signed for 53,000 sq. m 19 July 23, 2010 Skanska Six Month Report 2010
Infrastructure Development Income statement Jan–Jun Jan–Jun Jul 2009– Jan–Dec 2010 2009 Jun 2010 2009 SEK M Revenue 104 102 153 151 Gross income -34 0 -93 -59 Selling and administrative expenses -75 -81 -149 -155 Income from joint ventures and associated companies 372 233 540 401 Operating income (EBIT) 263 152 298 187 of which gains from divestments of shares 183 0 183 0 in projects 20 July 23, 2010 Skanska Six Month Report 2010
Unrealized development gains, ID projects Jun 30 Mar 31 Jun 30 SEK bn 2010 2010 2009 Present value of cash flow from projects 12.3 11.2 11.4 Present value of remaining investments -1.2 -0.9 -1.3 Net present value of projects 11.1 10.3 10.1 Carrying amount -2.1 -2.1 -2.4 Unrealized development gain 9.0 8.2 7.7 21 July 23, 2010 Skanska Six Month Report 2010
Recommend


More recommend
Explore More Topics
Stay informed with curated content and fresh updates.