Simulation of radioactive pollution of seawater as a result of the - PowerPoint PPT Presentation
RUSSI AN ACADEMY OF SCI ENCES Nuclear Safety I nstitute (NSI RAS), Moscow Simulation of
РОССИЙСКАЯ АКАДЕМИЯ НАУК Институт проблем безопасного развития атомной энергетики RUSSI AN ACADEMY OF SCI ENCES Nuclear Safety I nstitute (NSI RAS), Moscow Simulation of radioactive pollution of seawater as a result of the accident at Fukushima-1 from the point of view of potential danger of radiation transportation on long distances Sorokovikova O.S., Semenov V.N., Dzama D.A.(NSI RAS) I RKUTSK, ENVI ROMI S-2012
This radioactive emission is the largest one among emissions of artificial radio- nucleus into water 11 march 2011 the earthquake was happened in Japan Radioactive pollution in nearby seawater Fukushima 2 4 1 3 Daiichi (1) NPP as a result of the accident was happened
TECHNI CAL CRI SI S CENTER of ROSATOM (locate in NSI RAS, Moscow) • The TCC of ROSATOM has a collection of information-modeling systems for decision support making, monitoring, forecasting and analysis of the radiation situation
Goals of the work • The main goal of the work is to perform express analyses of hypothetically radioactive contaminations in sea water nearby Russian coasts • Forecast the radiation situation in sea water near Japan
I nformation-modeling computer system • Express computer system, called NEPTUN-1 has been created especially for the Pacific ocean aquatic and used to solve the problem ÷ 110.5E 179.5E • The available region is ÷ 30.5N 64.5N • The system uses two dimensional velocity streams in the upper layer above the seasonal thermo wedge, distributed in space and time • There was taken into account downward motion in the lower layers of the seasonal thermo wedge and other processes • The computer system NEPTUN-1 contains the database on more than 100 nuclides and their decay chains
NEPTUN-1 transport equation Transport equation: ∂ ϕ θ ∂ ϕ ϕ θ ϕ θ ∂ ϕ θ ϕ θ H ( , ) c cos H ( , ) cu ( , ) H ( , ) cv ( , ) + + − ∂ ϕ∂ ϕ ϕ∂ θ t a cos a cos ∂ ϕ θ ∂ ϕ θ c H ( , ) c H ( , ) ∂ ϕ ∂ K cos K ϕ ∂ ϕ θ ∂ θ − = ϕ θ Q ( , , ) t ϕ ∂ ϕ ϕ∂ θ 2 2 2 a cos a cos – depth of the layer above the seasonal thermo wedge H (mixed layer depth) – concentration of radionuclide's ( Bq/ q/ m ^ 3 ) c u & v – longitude and latitude components of currents – source term Q φ & θ – longitude and latitude
Numerical solution of the transport equation by lagrange big particle stochastic movement I nitial condition for the Lagrange particles: = = X x , Y y = = t 0 0 t 0 0 Convection part: + + + ϕ = ϕ + ∆ ϕ θ = ϕ θ + ∆ n 1 n n n 1 n 1 n n n a a u t cos a a cos v t i i i i i i i i Diffusion part: + + + ϕ = ϕ + ∆ ϕ θ = ϕ θ + ∆ n 1 n n 1 n 1 n n a a 2 K tb cos a a cos 2 K tb ϕ θ i i n i i i i n Size particle’s increasing: ( ) ( ) ( ) 2 2 + = + − ∆ n 1 n 2 R R K K t i i n n
Downward motion in the lower layers Mass (i.e. radioactivity) of the Lagrange particle reduces: ( ) θ ϕ + = w , dm + = − 1 n n m m m dm ( ) θ ϕ dt H , Here m − particle mass (Bq) H – mixed layer depth(seasonal thermo wedge depth) ( ) 1 + = + + − + + + j 1/2 j 1/2 j 1/2 j 1/2 j 1/2 w u H u H + + + + 1/2 1 1 i i i i i j 1/2 dx ( ) 1 − + + j j j 1 j 1 v H v H + + + + + i 1/2 i 1/2 i 1/2 i 1/2 i 1/2 dy Velocit y dat a cell
Horizontal turbulent diffusion model (Ozmidov) We use the Ozmidov model to parameterize the horizontal diffusion of the contamination: ( ) ε ≤ 1/3 4/3 c l l l h m ( ) τ = K l ( ) τ ε > 1/3 4/3 c h h l h m τ τ τ ≤ 1e-8, l 1e+4 m ( ) ε = l > 1e-9, l 1e+4 m Here K τ − the horizontal diffusion coefficient (m2/ s) L − spatial scale of the contamination (m) ε − turbulent energy dissipation (m2/ s2) h τ − sea currents data grid size (m)
March - mean ocean currents
March - mean ocean currents
Ocean currents (10 April 2011, data resolution - 1/ 32 degree)
Main nuclides contained in the release on Fucushima-1 Nuclide Half-life 131 I 8 days 137 Cs 30.15 years 134 Cs 2.1 years 136 Cs 13.1 days 132 Te − 132 I 78 hours
Time integrated concentration, conservative estimation (source – 1MCu of Cs-137) East coast West coast
Concentration, conservative estimation (1MCu of Cs-137, east) Critical concentration of Cs-137 is 350 Bq/m3 Instantaneous source 4 days source
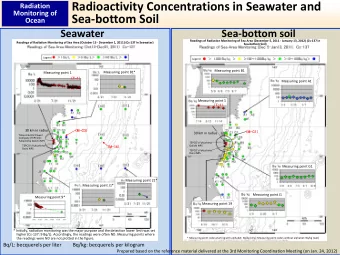
Concentration of Cs-137 & I -131 measurement points (MEXT, Japan)
Concentration, collected from all measurement points Cs-137 I-131
Assessment source of Cs-137 and I -131 estimation • Assessment of the maximum concentration at emission form the atmosphere gives a much less values (5-10% of maximum observed values) • Therefore the main source of sea water pollution − is direct emission from the NPP to the water area • Comparison of sampling and model data • Estimate of Cs-137 radioactivity gives 0.03MCu • Estimate of I -131 radioactivity gives 0.07M С u
CONCLUSI ONS • Analysis of simulation results has shown that as opposed to the on-ground ecosystems where residual radioactive pollution would exist many years, the period of pollution of the seawater in the discussed region will few months • There is no any potential danger to the Russian east coastal water areas • The contamination, which is the result of the main emission of the radioactive water from NPP Fucushima-1 to the ocean, hasn’t been detected after ~ 1.5-2 month in the measurements points (MEXT, 30km form the coastline) • Hypothetical secondary washout from the contaminated land can be a problem only in the immediate vicinity of the coastline (for region closer 30km)
Thank You for attention!
Recommend


More recommend
Explore More Topics
Stay informed with curated content and fresh updates.