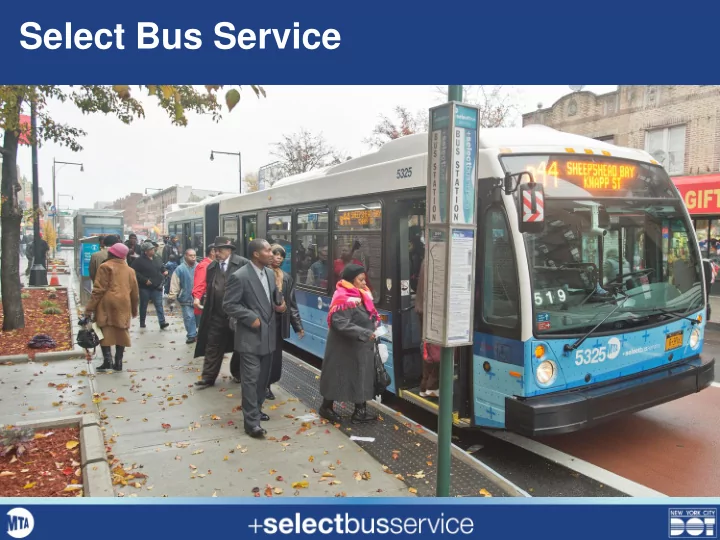

Select Bus Service
New York City Context 2
New York City Context 3
Transit Context 8.5 million 1,750 million NYC Population Annual subway ridership 665 million Annual bus ridership 1994 1996 1998 2000 2002 2004 2006 2008 2010 2012 2014 4
Bus Speeds 8.60 Average Speed (MPH) 8.40 8.20 8.00 7.80 7.60 7.40 7.20 7.00
Transit Accsesibility Mobility: Over 2.5 million trips are made on New York City’s buses every day. Slow bus service means long commutes, and encourages private vehicle use. Equity: Bus trips are disproportionately made by lower income populations, and provide the only access to areas with more limited availability of jobs and services.
Before After
Sources of Bus Delay Other Delays 3% Traffic Lights 21% In Motion 54% Bus Stops 22%
Off-Board Fare Payment
Off-Board Fare Payment
Bus Lanes
Stations
Passenger Information
Transit Signal Priority
Pedestrian Safety Upgrades 21
Community Outreach 22
SBS Implementation: In-House
SBS Implementation: Capital
Faster Service – Speeds have increased by 15-30% Increased Ridership – Trips increased by 10% Popular – Customer satisfaction of 95%+ Safer – Crashes reduced by over 20% Proven Success – 12 SBS routes in operation, carrying over 300,000 passengers daily 25
Recommend
More recommend