
SLIDE 1
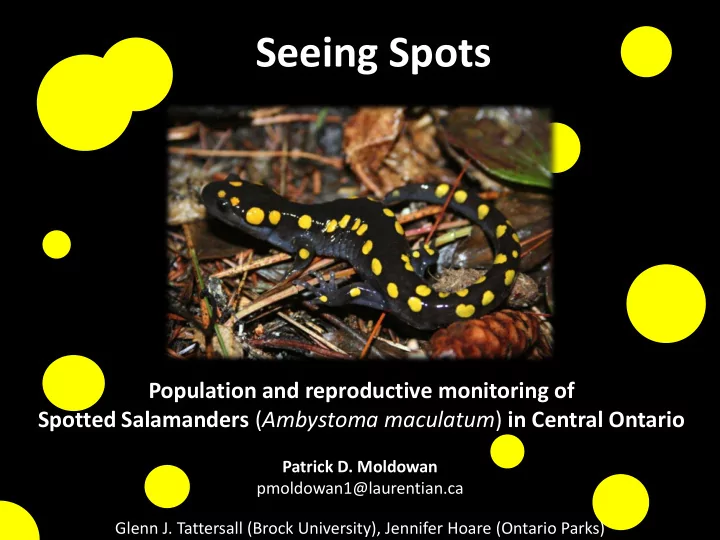
Population and reproductive monitoring of Spotted Salamanders (Ambystoma maculatum) in Central Ontario
Seeing Spots
Patrick D. Moldowan pmoldowan1@laurentian.ca Glenn J. Tattersall (Brock University), Jennifer Hoare (Ontario Parks)
Seeing Spots Population and reproductive monitoring of Spotted - - PowerPoint PPT Presentation
Seeing Spots Population and reproductive monitoring of Spotted Salamanders ( Ambystoma maculatum ) in Central Ontario Patrick D. Moldowan pmoldowan1@laurentian.ca Glenn J. Tattersall (Brock University), Jennifer Hoare (Ontario Parks) Field site
Patrick D. Moldowan pmoldowan1@laurentian.ca Glenn J. Tattersall (Brock University), Jennifer Hoare (Ontario Parks)
Bat Lake, Algonquin Provincial Park
intolerant of acidic conditions (Pierce
1985)
4.0-5.0 and 50% mortality between 5.0-7.0
(Pough and Wilson 1977, Cook 1983)
. . . but Bat Lake has a reproducing population at pH 4.2 . . .
Matt Keevil Glenn Tattersall
1) Monitor the arrival and departure dates of Ambystoma maculatum at their breeding environment 2) Estimate the population size and operational sex ratio of salamanders at Bat Lake 3) Determine the local pond use patterns and map migration corridors to the lake 4) Determine the total egg mass deposition in Bat Lake 5) Monitor morphological parameters of adult spotted salamanders 6) Monitor year-to-year variation in the above parameters and establish a database for future ecological, physiological or conservation studies.
5 10 15 20 25 30 35 115 119 123 127 131 135
Objective 1
Sean Boyle
Number of Individuals
Female Male
Sean Boyle
Objective 2
Malecaptures Female captures
Objective 2
1000 2000 3000 4000 5000 6000 7000 2009 2010 2011 2012
Objective 2
Objective 3
Objective 4
May 6 May 2 April 30 April 30 April 25 April 23 April 25 April 27 April 7 April 30 April 14
slope = -0.82 days per year
y = -0.8166x + 1752.2, R² = 0.4284 Objective 4
2011 recapture 2008 capture
uniquely identified in the Bat Lake population
egg laying phenology, population dynamics, lake usage patterns, migration routes, and rate of injury and deformity, etc
90 100 110 120 130 140 150 2008 2009 2010 2011 2012 2013
20 28 42 26 21 18
April 9 May 19 April 22 May 17
Objective 1