Seawall Finance Work Group Draft Report Update to the Capital Planning Committee Office of Resilience and Capital Planning 6/12/2017
Seawall Finance Work Group (SFWG) Overview 2 Mission: Analyze and prioritize the funding need Seawall Resiliency Project Part of San Francisco’s participation in the Living Cities City Accelerator Cohort Draft recommendations and report
SFWG Membership 3 Chair: Office of Resilience and Mayor’s Office Capital Planning Office of Economic and Board of Supervisors Workforce Development City Administrator’s Office – Port of San Francisco Risk Management Program SFMTA Controller’s Office – Office of Private sector financial expert Public Finance
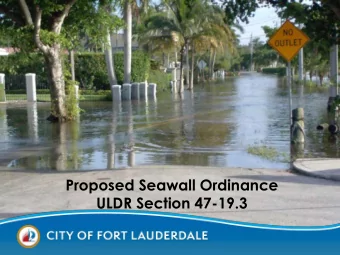
Vulnerability of San Francisco’s Seawall 4 Fisherman’s Wharf 1850’s Shoreline Mission Creek Pre-1906 Seawall 1906-1916 Seawall
The Seawall Today 5 Supports historic piers, wharves, and buildings Underpins major tourist destinations on the waterfront Serves as a critical emergency response and recovery area Supports BART, Muni, and ferry transportation and utility networks Provides flood protection to downtown San Francisco
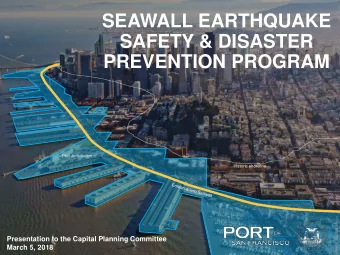
Seawall Resiliency Project Plan 6 Port staff have envisioned 2 major phases to the Project: Phase I – seismic improvements to address the most critical life safety and flood risks at TBD, isolated locations along the Seawall Phase II – potential replacement of the entire 3 miles of the Seawall with all seismic and sea level rise adaptation measures Project Phase Budget Duration Start Finish Phase I Overview $500 million 11 years January 2015 December 2025 Vulnerability Study $1.0 million 1.5 years January 2015 June 2016 Planning $8.5 million 2.5 years July 2016 December 2018 Preliminary Design & $25.5 million 2.0 years January 2019 December 2020 Environmental Approvals Final Design & $465.0 million 5 years January 2021 December 2025 Construction Phase II Overview ~ $5 billion ~ 20 years January 2026 January 2046 Note: Project cost estimates are in 2016 dollars and do not take into account the time value of money. It is important to consider the influence inflation will have on the overall cost of repairing the Seawall over time.
Seawall Resiliency Project Phase I Funding Need (1/2) 7 $500 Million Immediate Investment <10-years Address life-safety & flood risks Long-term ~$5 billion need for seismic and sea level rise adaptation measures $355 Million Planned/Proposed Funding $4.0 million City Revolving Fund (to be reimbursed from Bond) $4.9 million Port ($2.9M), MTA ($1.0M), and Planning ($1.0M) investments $350 million G.O. Bond Measure in the proposed Capital Plan (assuming voter approval) The SFWG will recommend sources to address remaining $145 million gap for the first $500 Million and the longer-term $5 billion need
Seawall Resiliency Project Phase I Funding Need (2/2) 8 FY16-17 FY17-18 FY18-19 FY19-20 FY20-21 FY21-22 FY23-26 Total Funding Sources Port Capital $2.9 $2.9 City Revolving Fund $1.0 $3.0 -$4.0 $0.0 MTA Contribution $0.5 $0.5 $1.0 Planning Department Contribution $0.5 $0.3 $0.3 $1.0 2018 General Obligation Bond $6.7 $7.2 $18.6 $19.7 $297.8 $350.0 Total Planned Sources $4.9 $3.8 $3.0 $7.2 $18.6 $19.7 $297.8 $354.9 Uses of Funds Project Staffing $0.6 $0.9 $0.9 $0.9 $0.9 $1.0 $4.8 $10.0 $1.0 $0.6 $0.4 $2.0 Public Outreach Planning $5.3 $2.4 $7.7 Preliminary Design/Entitlements $5.8 $7.9 $3.9 $17.6 Final Design & Engineering $5.0 $10.1 $28.6 $43.7 Construction $4.8 $4.8 $409.5 $419.0 Total Estimated Uses $0.6 $7.2 $3.9 $7.2 $18.6 $19.7 $442.9 $500.0 Cumulative Balance $4.3 $0.9 $0.0 $0.0 $0.0 $0.0 -$145.1 -$145.1
SFWG Work Process 9 10 meetings between November 2016 and May 2017 Work to date: Analysis of Research on 48 funding strategies 48 possible funding based on the strategies criteria Establishment Drafted of 11 recommendations evaluation and report criteria
SFWG List of Funding Strategies 10 The SFWG analyzed 48 local, regional, state, and federal possible funding strategies: State Resilience G.O. Bond Commuter Transportation Tax Business License Tax Surcharge State Share of Property Tax Vehicle License Fee Increase RM3- Bridge Tolls Increment Tax/Fee on Auto Sales Cap & Trade Program Funding Incorporate into Pier Rehab Projects Tax/Fee on Marina Uses Regional Gas Tax Geologic Hazard Abatement Transit Impact Development Fee Congestion Pricing Districts (GHADs) Increased Parking Revenues Tax/Fee on Rental Cars Surcharge on Event Tickets G.O. Bonds Business Gross Receipts Tax Transit Pass Transfer Fee Surcharge Assessment District Increase Ferry Charges Hotel Assessment CFD/Mello-Roos Cruise Ticket Surcharge Infrastructure Trust Bank Port IFD Hazard Mitigation Grants Green/Climate Bonds IRFDs National Foundation Grants Environmental Impact Bonds Sale/Lease Increment of Port Assets Historic Tax Credits Advertising Insurance Value Capture/Resilience Federal Transportation Funding Bonds Naming Rights Army Corps of Engineers (USACE) – Sales Tax Increase Public Private Partnerships General Investigation Parcel Tax Philanthropy USACE – CAP 103 Program Real Estate Transfer Tax Increase Pension Plan Investment DHS Office of Infrastructure Utility User Tax Surcharge Protection
SFWG Heat Map 11 Key: 5 Strength 5 4 Partial strength 4 3 Neither strength nor weakness 3 2 Partial weakness 2 1 Weakness 1 *** Criteria Triple Weighted Revenue Source of Generating Cost of Long Term Flexibility of Tradeoffs for State/Federal Local/Regional Administrative Equity/Cost Rank Funding Strategy Funds Potential *** Funds Sustainability Funds Timing Other City Needs Political Feasability Political Feasability Complexity Burden Weighted Average 1 Local Property Tax Increment from IFDs 5 5 5 4 5 5 4 5 5 4 5 4.77 2 Community Facilities District (CFD) 5 5 5 5 5 3 4 5 3 3 5 4.46 3 USACE – CAP 103 Program 5 5 4 3 3 5 5 4 5 3 5 4.38 4 State Property Tax Increment from IFDs 5 5 3 5 5 3 4 3 5 3 5 4.31 5 General Obligation (G.O.) Bonds 5 5 5 5 3 3 2 5 3 5 4 4.23 6 Cap & Trade Program Funding 5 5 5 3 3 5 3 3 3 5 5 4.23 7 State Resilience G.O. Bond 5 5 5 5 3 3 4 3 3 4 5 4.23 8 Sales Tax Increase 5 5 5 5 5 3 1 5 2 5 3 4.15 9 Hotel Assessment 5 5 4 3 5 3 2 5 2 4 5 4.08 10 Increased Parking Revenues 5 5 5 3 3 3 2 5 1 5 5 4.00 11 Assessment District 5 5 5 5 5 3 3 4 1 1 5 4.00 12 USACE – General Investigation 5 5 5 5 3 1 3 3 3 2 5 3.85 13 Philanthropy 5 2 5 2 5 2 4 5 5 5 5 3.77 14 Historic Tax Credits 5 3 5 2 1 3 5 5 5 4 5 3.77 15 Tax/Fee on Marina Uses 5 1 5 5 5 5 3 5 1 5 5 3.62 16 Cruise Tickets Surcharge Increase 5 1 3 5 5 3 5 5 4 4 4 3.54 17 Advertising 5 1 2 3 5 5 5 5 2 5 5 3.46 18 RM3- Bridge Tolls Program 5 5 5 5 3 2 1 1 2 3 3 3.46 19 Vehicle License Fee (VLF) Increase 5 3 3 2 5 3 1 5 1 5 5 3.38 20 Parcel Tax 5 3 5 2 5 3 2 5 2 5 1 3.38 21 Naming Rights 5 1 5 2 5 4 4 5 2 3 5 3.31 22 Congestion Pricing 5 5 3 5 3 2 2 2 1 1 2 3.15 23 Public Private Partnerships (P3s) 1 4 1 3 5 3 5 4 1 3 2 3.08 24 Utility User Tax Surcharge 5 3 2 3 5 2 1 3 1 4 3 2.92 25 Transit Impact Development Fee 5 1 1 3 2 5 1 5 2 4 5 2.77 26 Federal Transportation Funding - TIFIA 3 4 3 3 3 1 2 1 3 1 4 2.77 27 Real Estate Transfer Tax Increase 3 3 3 3 3 3 1 5 1 1 3 2.69 28 Surcharge on Event Tickets 4 1 1 3 4 3 2 5 1 5 3 2.62 29 Environmental Impact Bonds 5 1 3 2 4 2 2 5 2 2 4 2.62 30 Sale/Lease Increment of Port Assets 2 2 3 4 5 2 1 1 1 5 4 2.62 31 Regional Gas Tax 3 4 1 1 3 2 1 2 1 3 3 2.46 32 Increased Ferry Charges 5 1 1 2 4 2 3 2 1 4 3 2.31 33 Hazard Mitigation Grants 5 1 3 1 1 1 3 1 3 4 5 2.31 34 Pension Plan Investment 2 3 3 1 4 1 2 1 2 2 3 2.31 35 Geologic Hazard Abatement Districts 3 1 1 3 4 1 4 3 1 1 5 2.23 36 Infrastructure Trust Bank 4 2 1 1 3 2 2 1 1 1 4 2.00 37 Transit Pass Transfer Fee 1 1 1 1 1 1 1 1 1 1 1 1.00 38 Resilience Bonds/Insurance Value Capture 1 1 1 1 1 1 1 1 1 1 1 1.00
SFWG Evaluation Process 12 5 Considerations: Revenue Administrative Generating Timing Complexity Potential Political Cost Burden Feasibility
Recommend
More recommend
Unleash a World of Digital Possibilities—Browse, Share, and Explore Content Without Boundaries