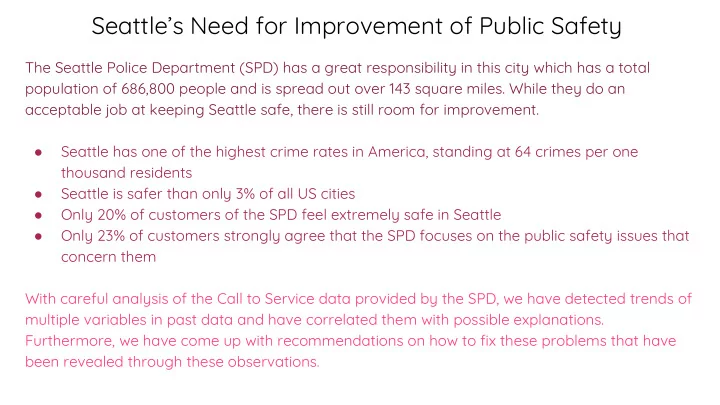

Seattle’s Need for Improvement of Public Safety The Seattle Police Department (SPD) has a great responsibility in this city which has a total population of 686,800 people and is spread out over 143 square miles. While they do an acceptable job at keeping Seattle safe, there is still room for improvement. Seattle has one of the highest crime rates in America, standing at 64 crimes per one ● thousand residents Seattle is safer than only 3% of all US cities ● Only 20% of customers of the SPD feel extremely safe in Seattle ● Only 23% of customers strongly agree that the SPD focuses on the public safety issues that ● concern them With careful analysis of the Call to Service data provided by the SPD, we have detected trends of multiple variables in past data and have correlated them with possible explanations. Furthermore, we have come up with recommendations on how to fix these problems that have been revealed through these observations.
Overall Trends: Data Table The most common type of crimes are traffic related, ● making up about 18% of total calls. Vice calls were the least common type of crime, making ● up about .001%
Overall Trends Con’t: The top graph shows the total ● number of calls for each district of Seattle The bottom graph shows the ● number of calls per capita annually for each district In both graphs, districts K and ● M have the highest amount of crime District B has the lowest ● amount of crime based on the number of crimes per capita annually
The Impact of Employment on Crime Using Seattle’s 2017 population estimate in conjunction with the Call to Service data, the amount ● of annual calls per capita was approximately 0.608 overall for Seattle (Assefa). Districts K and M (outliers) have the two highest numbers of annual calls per capita, at 4.807 and ● 2.416, respectively. Forbes recently reported Seattle’s ● unemployment rate to be 2.9%, while Districts K and M have respective unemployment rates of 9.1% and 11.1% (Worstall) Districts K and M both have higher ● amounts of crime and unemployment rates compared to Seattle as a whole. Solution: Extend employment outreach programs in ● these districts to curb the correlating crime rates
The Impact of Poverty on Crime The percentage of Seattle’s population that lies below the poverty line is ● approximately 14.7% (Seattle). Districts K and M have much higher percentages below the poverty line, at 44% and ● 29.1%, respectively. Furthermore, the percentage of the ● population below the poverty line in districts K and M is considerably higher than the state and national percentages. Solution: Addressing this underlying cause by ● ensuring adequate financial aid, access to affordable housing, and access to affordable meals could help to alleviate the pressures of poverty upon the community and therefore reduce the amount of crime. (Seattle, Gongloff)
Seattle’s Top Performing District As would be expected, Seattle’s district with the least amount of annual calls per capita exhibits ● the opposite qualities of the most call-dense districts. District B has an unemployment rate of approximately 5.0%, and only around 15.0% of the ● population living below the poverty line. Social programs employed in District B should be examined and replicated in more ● poorly-performing districts K and M, as the correlation between employment and poverty to amount of crime is clear.
Break Down of Traffic Related Calls into Subgroup: Percent of the Seattle Police Department’s calls that are traffic related: 17.9% If they could cut down the number of traffic related calls, they would have more time to investigate more serious offenses. In this way, the number of inaccurate convictions would decrease while the overall public safety of Seattle would increase. Distribution of Traffic Related Call Solutions: Education/raising awareness of ● road rules and safety From our data, liquor violations are ● the 4th most common type of call Therefore, enforcing valid ○ identification when purchasing alcohol would reduce both liquor violations and DUI problems More available parking in city ●
What do we notice and what do we do about it? - Liquor violations are most likely to occur in district K while district O is the most likely to call about traffic related issues - Decrease the number of liquor stores and promote more beneficial activities (service, environment, etc.) in district K - Add more road surveillance and station more officers near notoriously dangerous intersections in district O - Burglaries are most likely to happen in district U - Improve home/store security systems (intrusion sensors, remote door lock, door bell camera, etc.)
Works Cited Assefa, Samuel. “Population & Demographics.” Population & Demographics - OPCD , City of Seattle, 2017. Gongloff, Mark. “45 Million Americans Still Stuck Below Poverty Line: Census.” The Huffington Post , TheHuffingtonPost.com, 16 Sept. 2014. “Seattle, WA Real Estate and Demographic Data.” Neighborhood Scout, 2o17, https://www.neighborhoodscout.com/wa/seattle “Seattle, Washington (WA) Poverty Rate Data.” Seattle, Washington (WA) Poverty Rate Data - Information about Poor and Low Income Residents Living in This City . “September 2016 Service Quality Update Report.” Seattle Police Department. October 24, 2016. Accessed October 22, 2017. https://www.seattle.gov/Documents/Departments/Police/Publications/CustomerSurveyReportSep2016.pdf Worstall, Tim. “Seattle's 2.9% Unemployment Rate Tells Us Nothing About The Effects Of Seattle's Minimum Wage Rise.” Forbes , Forbes, 5 Apr. 2017.
Recommend
More recommend