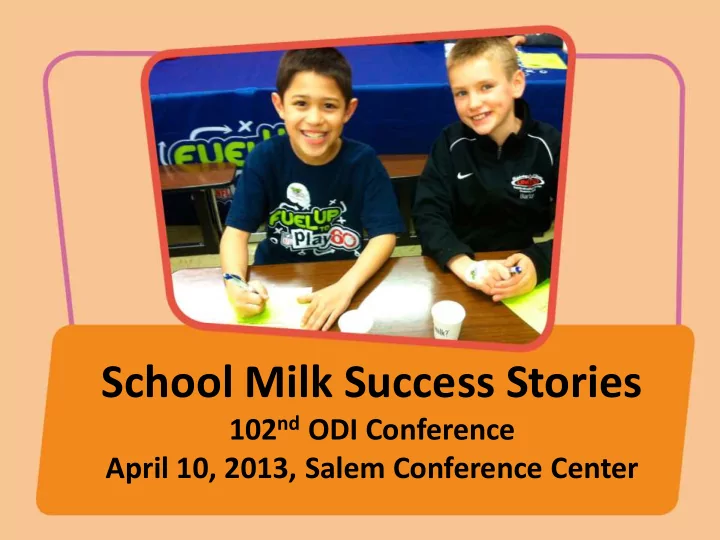

School Milk Success Stories 102 nd ODI Conference April 10, 2013, Salem Conference Center
School Milk • Background • OR and WA Experiences • Panel with Audience Q and A – School Nutrition – Processors
School Teams Oregon Dairy Council/ Oregon Dairy Products Commission Anne Goetze, RD, LD Director of Nutrition Affairs Crista Hawkins, RD, LD Manager of School Nutrition and Programs Cara Seger, MEd Fuel Up to Play 60 Coordinator
School Teams Washington State Dairy Council/ Washington Dairy Products Commission Debra French, RD, CD Executive Director Cara Nichols, RD, CD School Program Manager
The Wellness Impact Improved nutrition, daily breakfast and increased physical activity can lead to improved academic performance
Child Health and Nutrition Focus on obesity – USDA 2010 Dietary Guidelines for Americans – New school meal patterns
Child Health and Nutrition Focus on obesity – Pending “Competitive Foods” Regulations
Child Health and Nutrition Focus on obesity • reducing added sugar and sugar- sweetened beverages
Child Health and Nutrition The good news: • Milk is recommended The challenge • Environment for flavored milk
2011-12 Summary : School Milk Declined 1.1% White milk grew 2.5%, or nearly 3.5 MM gallons, but could not offset the losses across all flavors. Flavors declined 8.5 MM gallons, as schools reduced their offerings. Chocolate declined 5.9 MM gallons, compared to losing 2 MM per year in each of the prior two years. ’08 - ’09 ’09 - ’10 ’10 - ’11 ‘11 - ’12 Change Flavor Gallons % Mix Gallons % Mix Gallons % Mix Gallons % Mix Gallons % YA White 139.1 29.6 132.0 28.7% 139.8 30.6% 143.3 31.7% +3.5 +2.5% MM MM MM MM MM Chocolate 288.6 61.4 286.6 62.3 284.3 62.2 278.4 61.6 -5.9 -2.1 Strawberry 32.9 7.0 35.0 7.6 27.0 5.9 25.3 5.6 -1.7 -6.3 All Other 9.4 2.0 6.4 1.4 5.9 1.3 5.0 1.1 -0.9 -15.3 470 100 460 100 457 100 452 100 -5.0 -1.1% Source: Processor based projection
Milk Unit Sales Down Slightly vs. Year Ago Collectively, across 29 Pilot school districts nationwide, total milk sales (in 8oz units) were down -2.6%. # Milk analysis includes an additional one (1) district which provided Milk Sales for all requested time periods; no ADP data was provided. Since the impact of the new regulations on milk sales is the primary objective of the evaluation study, this district was included here, resulting in a total of 29. A Serving Day is defined as a day of school where Milk, Breakfast, and/or Lunch is made available to students. 2 Month Total of Milk Units Sold provided by District contact and S/R
Oregon School Milk Sales Reports from top three districts – Overall food costs are up – Participation is down, ave. 4% – Milk sales steady – Cost differential could be consideration in continuing to offer flavored milk
Oregon School Milk Sales Reports from processors – Holding steady vs. last year – Some districts returning chocolate milk to menu
Oregon School Environment • ODE Child Nutrition Program • Parents and community activists • Health professionals • Public health advocates
Oregon School Environment Retail vs. school • Lack of understanding about special formulation for school chocolate milk. • Most think same as retail.
Oregon School Environment Processors have responded – Innovation – Fat Free chocolate • 130-150 Calories • Added sugar as low as 10 grams • GREAT TASTE
Oregon School Environment Wellness is promoted and rewarded! • ODE Wellness Awards • USDA Healthier US School Challenge • SNAP-Ed program • Oregon Farm to School program
School Wellness Programming Fuel Up to Play 60 • in-school nutrition and physical activity program that's making wellness part of the game plan in schools
The Kids Have Spoken Taste test with Fuel Up to Play 60 student leaders – 14 students – Aged 10-12 – 11 of 14 usually drink chocolate milk at school
The Kids Have Spoken • Kids prefer chocolate milk at school • New formulations are well accepted • Kids don’t like unflavored milk at school
The Kids Have Spoken Given the opportunity to compare, they did! CHOCOLATE A B C D Average rating (1-5) 4.6 3.6 2.4 3.8 Rating Scale: 1= Like it and 5=Love it! Findings not scientifically significant due to small sample size. Reporting bias observed, though represented typically cafeteria environment where kids freely voice their opinions of foods.
The Kids Have Spoken Chocolate Milk Tasting The highest rated brand contained: – higher amount of total calories (150 kcal) – higher amount of total sodium (210mg) – lowest amount of total sugar (21g) The second-highest rated brand contained: – lower amount of calories (130 kcal) – intermediate amount of sugar (22g) – lower amount of sodium (190mg)
The Kids Have Spoken Chocolate Milk Tasting Comments: • These kids really like chocolate milk! • Comments ranged from “perfect” to “too watery”
The Kids Have Spoken Given the opportunity to compare, they did! UNFLAVORED A B C D 2.3 3.3 3.1 3.2 Average rating (1-5) Rating Scale: 1= Like it and 5=Love it! Findings not scientifically significant due to small sample size. Reporting bias observed, though represented typical cafeteria environment where kids freely voice their opinions of foods.
The Kids Have Spoken Unflavored Milk Tasting Comments: • These kids do not choose unflavored milk. • Comments ranged from “perfect” to “tastes like cardboard”
The Kids Have Spoken • Overall comments are VERY positive • New formulas are well accepted by kids in school setting
Success and Opportunities • Culinary Trainings • Breakfast • More education • Community advocacy • Stay true to moderation !
Recommend
More recommend