SCALASCA: Sc alable performance a nalysis of la rge- sc ale parallel - PowerPoint PPT Presentation
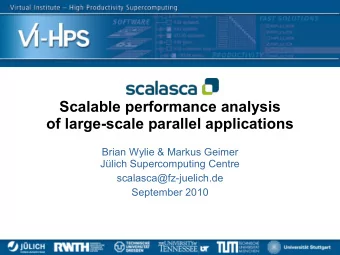
SCALASCA: Sc alable performance a nalysis of la rge- sc ale parallel a pplications Brian J. N. Wylie John von Neumann Institute for Computing Forschungszentrum Jlich B.Wylie@fz-juelich.de Outline KOJAK automated event tracing &
SCALASCA: Sc alable performance a nalysis of la rge- sc ale parallel a pplications Brian J. N. Wylie John von Neumann Institute for Computing Forschungszentrum Jülich B.Wylie@fz-juelich.de
Outline ● KOJAK automated event tracing & analysis ● New performance tool requirements ● Successor project focussing on scalability ● Scalable runtime measurement ● Usability & scalability improvements ● Integration of summarisation & selective tracing ● Scalable measurement analysis ● Process local traces in parallel ● Parallel event replay impersonating target ● Demonstration of improved scalability ● SMG2000 on IBM BlueGene/L & Cray XT3 ● Summary
The KOJAK project ● K Kit for O Objective J Judgement & Automatic K Knowledge-based A detection of bottlenecks ● Forschungszentrum Jülich ● University of Tennessee ● Long-term goals ● Design & implementation of a portable, generic & automatic performance analysis environment ● Focus ● Event tracing & inefficiency pattern search ● Parallel computers with SMP nodes ● MPI, OpenMP & SHMEM programming models
KOJAK architecture Semi-automatic Instrumentation user OPARI / modified program TAU instr. program POMP+PMPI libraries Compiler / executable Linker EPILOG trace library PAPI library execute EXPERT analysis CUBE analyzer result presenter EPILOG EARL event trace Automatic Analysis trace VTF/OTF/PRV VAMPIR/ converter event trace Paraver Manual Analysis
KOJAK tool components ● Instrument user application ● EPILOG tracing library API calls ● User functions and regions: ● Automatically by TAU source instrumenter ● Automatically by compiler (GCC,Hitachi,IBM,NEC,PGI,Sun) ● Manually using POMP directives ● MPI calls: Automatic PMPI wrapper library ● OpenMP: Automatic OPARI source instrumentor ● Record hardware counter metrics via PAPI ● Analyze measured event trace ● Automatically with EARL-based EXPERT trace analyzer and CUBE analysis result browser ● Manually with VAMPIR (via EPILOG-VTF3 converter)
KOJAK/ VAMPIR
CUBE analysis browser What problem? In what source context? Which processes and/or threads? How severe?
KOJAK supported platforms ● Full support for instrumentation, measurement, and automatic analysis ● Linux IA32, IA64 & IA32_64 clusters (incl. XD1) ● IBM AIX POWER3 & 4 clusters (SP2, Regatta) ● Sun Solaris SPARC & x64 clusters (SunFire, …) ● SGI Irix MIPS clusters (Origin 2K, 3K) ● DEC/HP Tru64 Alpha clusters (Alphaserver, …) ● Instrumentation and measurement only ● IBM BlueGene/L ● Cray XT3, Cray X1, Cray T3E ● Hitachi SR-8000, NEC SX
The SCALASCA project Sc alable performance a nalysis of la rge- sc ale parallel a pplications ● Scalable performance analysis ● Scalable performance measurement collection ● Scalable performance analysis & presentation ● KOJAK follow-on research project ● funded by German Helmholtz Association (HGF) for 5 years (2006-2010) ● Ultimately to support full range of systems ● Initial focus on MPI on BlueGene/L
SCALASCA design overview ● Improved integration and automation ● Instrumentation, measurements & analyses ● Parallel trace analysis based on replay ● Exploit distributed processors and memory ● Communication replay with measurement data ● Complementary runtime summarisation ● Low-overhead execution callpath profile ● Totalisation of local measurements ● Feedback-directed selective event tracing and instrumentation configuration ● Optimise subsequent measurement & analysis
SCALASCA Phase 1 ● Exploit existing OPARI instrumenter ● Re-develop measurement runtime system ● Ameliorate scalability bottlenecks ● Improve usability and adaptability ● Develop new parallel trace analyser for MPI ● Use parallel processing & distributed memory ● Analysis processes mimic subject application's execution by replaying events from local traces ● Gather distributed analyses ● Direct on-going CUBE re-development ● Library for incremental analysis report writing
EPIK measurement system ● Revised runtime system architecture ● Based on KOJAK's EPILOG runtime system and associated tools & utilities ● EPILOG name retained for tracing component ● Modularised to support both event tracing and complementary runtime summarisation ● Sharing of user/compiler/library event adapters and measurement management infrastructure ● Optimised operation for scalability ● Improved usability and adaptability
EPIK architecture Utilities archive config metric platform Event User Comp POMP PGAS PMPI Adapters Measurement EPISODE Management Event EPITOME EPILOG EPI-OTF Handlers
EPIK components ● Integrated runtime measurement library incorporating ● EPIK: Event preparation interface kit ● Adapters for user/compiler/library instrumentation ● Utilities for archive management, configuration, metric handling and platform interfacing ● EPISODE: Management of measurements for processes & threads, attribution to events, and direction to event handlers ● EPILOG: Logging library & trace-handling tools ● EPI-OTF: Tracing library for OTF [VAMPIR] ● EPITOME: Totalised metric summarisation
EPIK scalability improvements ● Merging of event traces only when required ● Parallel replay uses only local event traces ● Avoids sequential bottleneck and file re-writing ● Separation of definitions from event records ● Facilitates global unification of definitions and creation of (local−global) identifier mappings ● Avoids extraction/re-write of event traces ● Can be shared with runtime summarisation ● On-the-fly identifier re-mapping on read ● Interpret local event traces using identifier mappings for global analysis perspective
EPIK usability improvements ● Dedicated experiment archive directory ● Organises measurement and analysis data ● Facilitates experiment management & integrity ● Opacity simplifies ease-of-use ● File compression/decompression ● Processing overheads more than compensated by reduced file reading & writing times ● Bonus in form of smaller experiment archives ● Runtime generation of OTF traces [MPI] ● Alternative to post-mortem trace conversion, developed in collaboration with TU Dresden ZIH
Automatic analysis process ● Scans event trace sequentially ● If trigger event: call search function of pattern ● If match: ● Determine call path and process/thread affected ● Calculate severity ::= percentage of total execution time “lost” due to pattern ● Analysis result ● For each pattern: distribution of severity ● Over all call paths ● Over machine / nodes / processes / threads ● CUBE presentation via 3 linked tree browsers ● Pattern hierarchy (general ⇨ specific problem) ● Region / Call tree ● Location hierarchy (Machine/Node, Process/Thread)
Analysis patterns (examples) Profiling Patterns Total time consumed Total User CPU execution time Execution MPI API calls MPI OMP OpenMP runtime Unused CPU time during sequential execution Idle threads Complex Patterns Receiver blocked prematurely MPI/ Late Sender Sender blocked prematurely MPI/ Late Receiver Messages in wrong order Waiting for a message from a particular sender while other messages already available in queue Waiting for last participant in N-to-N operation MPI/ Wait at N x N Waiting for sender in broadcast operation MPI/ Late Broadcast Waiting in explicit or implicit barriers OMP/ Wait at Barrier
Initial implementation limitations ● Event traces must be merged in time order ● Merged trace file is large and unwieldy ● Trace read and re-write strains filesystem ● Processing time scales very poorly ● Sequential scan of entire event trace ● Processing time scales poorly with trace size ● Requires a windowing and re-read strategy, for working set larger than available memory ● Only practical for short interval traces and/or hundreds of processes/threads
Parallel pattern analysis ● Analyse individual rank trace files in parallel ● Exploits target system's distributed memory & processing capabilities ● Often allows whole event trace in main memory ● Parallel Replay of execution trace ● Parallel traversal of event streams ● Replay communication with similar operation ● Event data exchange at synchronisation points of target application ● Gather & combine each process' analysis ● Master writes integrated analysis report
Example performance property: Late Sender … … location … … time Enter Exit Send Receive Sender: Receiver: Triggered by send event Triggered by receive event ● ● Determine enter event Determine enter event ● ● Send both events to receiver Receive remote events ● ● Detect Late Sender situation ● Calculate & store waiting ● time
Example performance property: Wait at N x N … … 1 1 1 1 location 2 … … 2 2 2 3 2 … … 3 time Enter Collective Exit 3 3 ● Wait time due to inherent synchronisation in N-to-N operations (e.g., MPI_Allreduce) ● Triggered by collective exit event ● Determine enter events ● Distribute latest enter event (max-reduction) ● Calculate & store local waiting time
SMG2000@BG/L (16k processes)
Jülicher BlueGene/L (JUBL) ● 8,192 dual-core PowerPC compute nodes ● 288 dual-core PowerPC I/O nodes [GPFS] ● p720 service & login nodes (8x Power5)
Recommend
More recommend
Explore More Topics
Stay informed with curated content and fresh updates.
