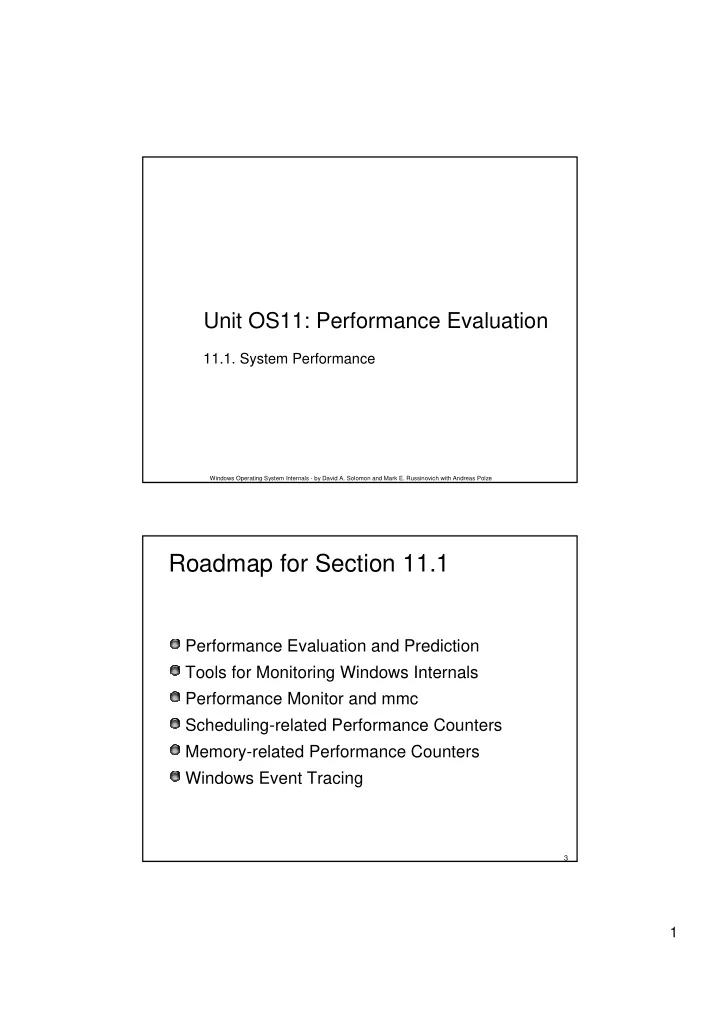
Roadmap for Section 11.1 Performance Evaluation and Prediction - PDF document
Unit OS11: Performance Evaluation 11.1. System Performance Windows Operating System Internals - by David A. Solomon and Mark E. Russinovich with Andreas Polze Roadmap for Section 11.1 Performance Evaluation and Prediction Tools for Monitoring
Unit OS11: Performance Evaluation 11.1. System Performance Windows Operating System Internals - by David A. Solomon and Mark E. Russinovich with Andreas Polze Roadmap for Section 11.1 Performance Evaluation and Prediction Tools for Monitoring Windows Internals Performance Monitor and mmc Scheduling-related Performance Counters Memory-related Performance Counters Windows Event Tracing 3 1
Performance Prediction and Evaluation Constructing a model of the system and then using the model to predict the system's behavior Model reflects system structure or organization as well as its workload or input Analyzed using mathematical techniques Alternatively, the model may be simulated Benchmarking & Monitoring Evaluating behavior of a live system Predefined workloads 4 Modeling Approaches Analytic modeling techniques Discrete- and continuous-time Markov chains Queueing theory, and queueing networks Approximate methods based on these techniques Operational analysis Non-stochastic, measurement-based perspective to the analysis of computer systems Modeled with discrete-event simulation Performance metrics from stochastic simulations are subject to statistical analysis (as are data obtained from real systems) 5 2
Validity of Models Models, whether analytic or simulation, can be inaccurate or implemented incorrectly An important aspect of any kind of performance modeling study is to validate the model and its implementation to whatever extent is possible One way to do this is to study a system using more than one model, e.g., a simulation model and an analytic model Analytic modeling of many systems is computationally demanding 6 Monitoring Windows - How to obtain Performance Data Windows is thoroughly instrumented Performance counters allow for monitoring of most kernel objects Many tools available to dig into Windows internals Helps to see internals behavior “in action” Several sources of tools Support Tools Resource Kit Tools Debugging Tools Sysinternals.com Additional tool packages with internals information Platform Software Development Kit (SDK) Device Driver Development Kit (DDK) 7 3
Tools for Windows Performance Monitoring Tool Image Name Origin File Monitor FILEMON www.sysinternals.com Global Flags GFLAGS Support Tools Handle Viewer HANDLE www.sysinternals.com Kernel debuggers WINDBG, KD Debugging tools, Platform SDK, Windows DDK Live Kernel Debugging LIVEKD www.sysinternals.com Open Handles OH Resource kits Page Fault Monitor PFMON Support Tools, Resource kits, Platform SDK Pending File Moves PENDMOVES www.sysinternals.com Performance tool PERFMON.MSC Windows built-in tool Pool Monitor POOLMON Support Tools, Windows DDK Process Explorer PROCEXP www.sysinternals.com Process Statistics PSTAT Support Tools, Windows 2000 Resource kits, Platform SDK, www.reskit.com Quick Slice QSLICE Windows 2000 resource kits Task (Process) List TLIST Debugging tools Task Manager TASKMGR Windows built-in tool TDImon TDIMON www.sysinternals.com 8 Process Explorer (Sysinternals) Shows performance-related data …plus full image path, command line, environment variables, parent process, security access token, open handles, loaded DLLs & mapped files 9 4
Obtain System Information with Process Explorer Click View->System Information 10 Overview of Performance Data Collection Windows defines performance data in terms of objects, counters, and instances A performance object is any resource, application, or service that can be measured System Monitor and Performance Logs and Alerts allow to select performance objects, counters, and instances to collect and present performance data Objects have performance counters Objects may also have instances, which are unique copies of a particular object type Not all object types support multiple instances _Total instance represents the sum of the values for all instances of the object for a specific counter 11 5
Vast Array of Performance Data 12 Performance Counter Aggregation into Performance Logs (via mmc) 13 6
Real-time Data Collection with Performance Monitor 14 Windows Performance Counters - Categories Monitoring Memory Management Memory\ Page Reads/sec Memory\ Page Writes/sec Memory\ Available Bytes Process\ Working Set Process\ Private Bytes 15 7
Windows Performance Counters - Categories (contd.) Monitoring Physical and Logical Disk I/O PhysicalDisk\ % Disk Time PhysicalDisk\ Avg. Disk Queue Length PhysicalDisk\ Current Disk Queue Length PhysicalDisk\ Avg. Disk Sec/Read PhysicalDisk\ Avg. Disk Sec/Write PhysicalDisk\ Disk Read Bytes/sec PhysicalDisk\ Disk Write Bytes/sec PhysicalDisk\ Avg. Disk Bytes/Read PhysicalDisk\ Avg. Disk Bytes/Write PhysicalDisk\ Disk Reads/sec PhysicalDisk\ Disk Writes/sec 16 Windows Performance Counters - Categories (contd.) Monitoring Network Activities Network Interface\ Bytes Total/sec Network Interface\ Bytes Sent/sec Network Interface\ Bytes Received/sec Protocol_layer_object\ Segments Received/sec Protocol_layer_object\ Segments Sent/sec Protocol_layer_object\ Frames Sent/sec Protocol_layer_object\ Frames Received/sec Server\ Bytes Total/sec Server\ Bytes Received/sec Server\ Bytes Sent/sec Network Segment\ % Network Utilization 17 8
Analyzing Processor Activity Determine the baseline on normal workload (from several weeks to a month) Processor\ % Processor Time counter System\Processor Queue Length counter Be aware of the Idle process … The Idle process runs a thread on each processor To measure the Idle process, use the Process(Idle)\ % Processor Time counter, or Processes tab in Task Manager Zero idle time could mean that the processor is handling a lot of work, but it could also mean that the processor or central processing unit (CPU) is overloaded 18 Detecting Processor Bottlenecks CPU bottlenecks are indicated by: Processor\ % Processor Time often exceeds 80 percent (and there is no compute-bound workload) System\ Processor Queue Length is often greater than 2 on a single-processor system Queue Length is the single most important parameter Other indications: Unusually high values appear for the Processor(_Total)\ Interrupts/sec or System\ Context Switches/sec counters 19 9
Evaluating Memory Usage Establish a reference point (or baseline) for physical memory usage under normal workload Create logs of memory usage over an extended period (from several weeks to a month) Relevant Performance Counters \Memory\Available Bytes \Paging File(_Total)\% Usage Exclude spikes; the range of values that seem to appear consistently constitutes your baseline 20 Detecting Memory Bottlenecks Indication for insufficient memory: Value for Memory\Available Bytes is consistently low (e.g. less than 5% of RAM) If available memory is consistently low, the computer becomes unresponsive: It is occupied exclusively with disk I/O operations During paging due to low memory, the processor is idle while waiting for the disk to finish 21 10
Examining Disk Performance Monitor disk counters along with counters from other objects. The following is a list of recommended counters. LogicalDisk\% Free Space PhysicalDisk\Disk Reads/sec PhysicalDisk\Disk Writes/sec PhysicalDisk\Avg. Disk Queue Length Memory\Available Bytes Memory\Cache Bytes Memory\Pages/sec Processor(All_Instances)\% Processor Time System\Processor Queue Length 22 Detecting a Disk Bottleneck Avg. Disk Queue Length for LogicalDisk or PhysicalDisk If the value of Avg. Disk Queue Length exceeds twice the number of spindles, then you are likely developing a bottleneck With a volume set, a queue that is never shorter than the number of active physical disks indicates that you are developing a bottleneck Notice that this might overstate the true length of the queue, because the counter includes both queued and in-service requests 23 11
Counters by Feature Windows services and apps may bring their own performance objects Internet Information Service Quality of Service (QoS) Admission Control Active Server Pages ACS/RSVP Service FTP Service ACS/RSVP Interfaces Web Service ACS/RSVP Policy Internet Information Services Routing and Remote Access Global (RRAS) Indexing Service RAS Port Indexing Service RAS Total Indexing Service Filter File Replication Service HTTP Indexing Service FileReplicaConn FileReplicaSet Message Queuing Terminal Service MSMQ Session Terminal Services Session MSMQ IS Active Directory™ MSMQ Queue NTDS MSMQ Service 24 Kernel Event Tracing Windows kernel and core device drivers are instrumented to record trace data Event Tracing for Windows (ETW) Common infrastructure in the kernel that provides trace data to the user-mode facility ETW is accessed by: Controllers that start and stop logging sessions and manages buffer pools Providers that define GUIDs for the event classes they can produce traces for; act on Controllers’ commands Consumer select one or more trace sessions for which the want to read trace data (in real-time or in log files) 25 12
Recommend
More recommend
Explore More Topics
Stay informed with curated content and fresh updates.
