
Richmond Minerals Inc. Ridley Lake Gold Project Swayze Greenstone - PowerPoint PPT Presentation
Richmond Minerals Inc. Ridley Lake Gold Project Swayze Greenstone Belt, North Central Ontario Overview Richmonds Ridley Lake Property is located in Rollo and Raney Townships, Porcupine Mining Division, north central Ontario, 40 km
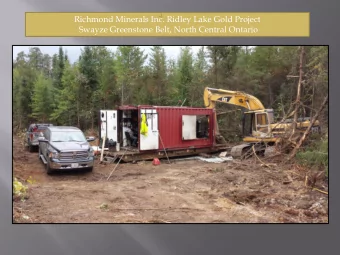
Richmond Minerals Inc. Ridley Lake Gold Project Swayze Greenstone Belt, North Central Ontario
Overview Richmond’s Ridley Lake Property is located in Rollo and Raney Townships, Porcupine Mining Division, north central Ontario, 40 km southwest of the town of Foleyet and 120 km west-southwest of the city of Timmins. The Property can be accessed year round by a network of logging and bush roads. The Property is centrally located within the Swayze Greenstone Belt, and covers an 8 kilometer section of the Ridout Shear Zone (the “RSZ”). The RSZ is currently believed to be the extension of the Larder Lake Break (i.e. host of the Kirkland Lake Gold Camp), and is the major structural feature in the region that is host to numerous gold deposits and occurrences. Recent significant gold discoveries nearby associated with the Ridout Shear Zone include the Trelawney Cote Lake deposit (acquired by Iamgold in April 2012 for $585 million) located on strike 48 km to the east, and the Probe Mines Borden Lake gold discovery (acquired by Goldcorp for $526 million), located on strike 37 km to the west. The Property consists of 196 contiguous unpatented single cell and boundary mining claims in which Richmond owns a 100% interest.
Exploration History and Local Geology Early exploration work on the Property dates back to 1932 prospecting. At that time two significant quartz vein systems (the Cyril Knight and the Aguara Showings) trending east/west were discovered in the central and north central property area. These veins were exposed on surface for lengths up to 245 m, with widths varying between 1 and 3 m. Gold assays from these veins were highly variable, with grades ranging from trace values up to 23 g/tonne gold (0.7 ounces per ton). Between 1932 and 1982, little exploration work was carried out on the Property. In 1982 Richmond staked claims covering the quartz vein showing areas and completed geophysical surveys, mapping, and trenching between 1983 and 1988. Results from this exploration work determined that the Aguara and Cyril Knight showing areas were coincident with magnetic and induced polarization anomalies of 3 to 4 times background levels.
Property Location and Regional Geology
Exploration History A limited program of diamond drilling testing the Aguara Zone geophysical anomalies and surface showings was undertaken in 1989 (2,471 m in 13 holes). Eleven of 13 holes intersected broad zones of gold mineralization, with one hole failing to reach its target depth due to caving. Further exploration work was halted in 1990 due to the filing of a Certificates of Pending Proceedings on the Property’s mining claims (the “Certificates”). The Certificates alleged that exploration funds intended for an unrelated mining project were actually used for exploration work on the Ridley Lake project. Exploration work remained dormant until the Ontario Superior Court dismissed the Certificates in January 2014, and the Ontario Court of Appeal dismissed the appeal of that decision in February 2015. In March 2015 the Certificates were discharged from title to the claims. At the time of the discharge, these proceedings were the oldest outstanding civil litigation in Ontario.
Hole No. From (m) To (m) Width (m) Grade (g/t Au) 89-1 217.7 223.5 5.8 0.65 255.8 268.6 12.8 1.00 89-2 97.1 98.62 1.52 1.16 111.43 112.43 1.0 3.1 164.33 170.43 6.1 0.25 89-3 69.97 128.05 58.08 0.31 including 118 128.05 10.05 0.64 89-4 105.7 112.2 6.5 1.2 156.71 161.43 4.72 4.35 157.55 159.74 2.19 7.96 including 89-05 67.07 126.26 59.19 0.37 89-06 145.73 204.88 59.15 0.33 including 201.52 204.27 2.75 1.86
Hole No. From (m) To (m) Width (m) Grade (g/t Au) 89-07 55.49 148.17 92.68 0.48 including 75.31 76.83 1.52 3.68 and 100.91 101.98 1.07 6.2 and 108.23 109.76 1.53 2.9 and 125.31 126.37 1.06 5.82 89-08 69.82 134.45 64.63 0.49 including 69.82 72.26 2.44 1.98 and 73.02 74.09 1.07 3.74 89-11 140.24 141.16 0.92 3.77 170.12 203.66 25.46 0.60 including 178.2 179.42 1.22 2.33 and 197.41 203.66 6.25 1.70 89-13 262.5 295.46 32.96 0.40 Notes: Assay data from Hole 89-12 is missing from historical reports. True widths are unknown. Holes 89-9 and 89-10 were drilled to test a VLF anomaly south of the Aguara Zone and returned no significant results.
Local Geology The Property is underlain by the Swayze volcanic complex or the Swayze-Deloro metavolcanic-metasedimentary belt. This complex is an east-west trending belt composed, from the margins inward of mafic metavolcanics succeeded by metasediments with several centres of felsic volcanism along its length. Dikes and sills of quartz-feldspar porphyry with occasional granitoid stocks are commonly found throughout the belt. Also common are mafic to ultramafic rocks intruding metasedimentary-metavolcanic sequences as diorite to gabbroic sills and as diabase dike sets.
Local Geology Gold mineralization discovered through diamond drilling in the Aguara Zone is associated with a variety of geological features that include: Shear zone development producing permeable conditions favourable for hydrothermal circulation. Carbonatization of mafic volcanics possibly releasing gold into the system. Development of silicified, carbonatized, chloritized, mineralized fracture zones. Emplacement of the feldspar porphyry sill/dike and quartz carbonate vein stockworks creating a “heat engine” for hydrothermal re-concentration and wall rock mineralization.
Exploration Program 2015 In June of 2015, a geophysical survey grid was cut on four of the Company's 100%-owned claims located immediately to the east of the Aguara gold showing, followed by the completion of Spectral Induced Polarization (IP)/Resistivity & Magnetic surveys. The surveys were successful in identifying a well-defined IP anomaly characterized by high chargeability and resistivity down to approximately 50 m and a prominent coincidental magnetic anomaly (the "Aguara East anomaly"), having a northeast orientation and a strike length in excess of 825 meters. To test these targets Richmond completed 900 m of diamond drilling in 6 holes, all having an azimuth of 180 degrees and at an inclination of -45 degrees.
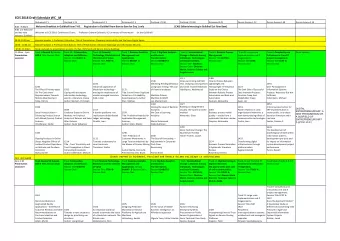
Aguara East Zone Summary of 2015 Drill Results Hole No. From (m) To (m) Width (m) Grade (g/t Au) RS15-14 45 132 87 0.32 including 66 74 8 1.12 and 80 82 2 1.81 122 125 3 0.90 and 129 132 3 1.29 and RS15-15 27 82 55 0.46 including 27 35 8 2.14 and 73 74 1 1.43 80 82 2 0.92 and RS15-16 64 108 44 0.42 64 65 1 1.11 including 86 88 2 1.04 and 89 90 1 1.32 and 91 92 1 2.54 and 103.1 107 3.9 1.05 and
Aguara East Zone Summary of 2015 Drill Results Hole No. From (m) To (m) Width (m) Grade (g/t Au) RS15-19 55 142 87 0.39 including 55 56.8 1.8 3.25 109 142 33 0.67 and 109 110 1 3.87 and 131.7 134 2.3 3.09 and 135 137 2 1.11 and 141 142 1 1.04 and Hole RS15-19 was drilled below hole RS15-16 and clearly indicates an increase of the • width of the gold-bearing zone and an increase of grade with depth (0.67 g/t in hole19 versus 0.42 g/t in hole 16 for the same vertical section). Holes RS15-17 and RS15-18 were drilled to test a separate IP anomaly identified • north of the Aguara East Anomaly at the northeast corner of the property and returned no significant values.
Exploration Program 2016 In July of 2016, Richmond conducted additional diamond drilling to test the well-defined Aguara East anomaly IP and magnetic anomaly at depths beneath the Phase I results reported in the fall of 2015 and along strike to the east. Richmond completed 1,121 meters of diamond drilling in five holes. As in the 2015 program, all holes were drilled at an azimuth of 180 degrees, and at an inclination of -45 degrees.
Hole No. From (m) To (m) Width (m) Grade (g/t Au) RS16-20 125.35 129.75 4.40 0.61 132.80 141.00 8.20 0.38 including 145.00 178.00 33.00 1.26 and 166.00 173.00 7.00 4.11 and 168.00 169.00 1.00 7.64 171.00 172.00 1.00 11.30 RS16-21 115.60 135.00 19.40 0.90 including 127.85 135.00 7.15 2.05 and 133.00 134.00 1.00 7.55 157.33 180.00 22.70 0.68 including 172.00 174.00 2.00 2.53 RS16-22 181.00 209.70 28.70 0.33 including 185.00 186.00 1.00 2.74 RS16-23 119.54 144.06 24.52 0.48 including 142.00 144.06 2.06 1.56 RS16-24 178.00 207.12 29.12 0.22 including 197.69 198.57 0.88 1.12
In November 2016 the Company completed a Spectral Induced Polarization (IP)/Resistivity survey to expand to depth the earlier IP survey completed in July 2015 on the Aguara East claims. Modelling of the data obtained from the combined surveys identified multiple targets at vertical depths down to IP survey limit of approximately 200 meters and may indicate stronger pyrite mineralization (and possibly gold mineralization) with depth. Testing these deep targets will be the primary focus of future drilling programs.
In August and September of 2017, Richmond completed 2,258 m of drilling in 8 holes Broad zones of gold mineralization, particularly in the Central Aguara Zone, were intersected Zones appear to be getting wider with depth
Recommend


More recommend
Explore More Topics
Stay informed with curated content and fresh updates.