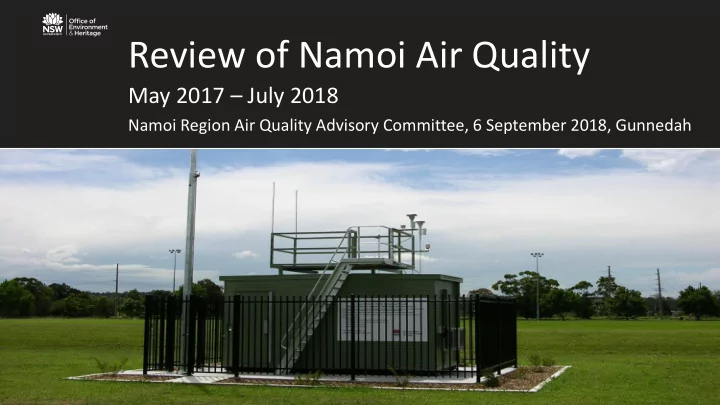

Review of Namoi Air Quality May 2017 – July 2018 Namoi Region Air Quality Advisory Committee, 6 September 2018, Gunnedah
Overview 1. Air Quality Index, Namoi May 2017 to July 2018 2. PM 10 and PM 2.5 trends 3. Poor air quality events: • Regional PM 10 on 15 April 2018 • Gunnedah PM 2.5 on 14-21 July 2018 2
Air Quality Index: Namoi Region, May 2017 to July 2018 90% Very Good to Good 3
Days above benchmark concentrations 4
Daily average PM 10 May 2017 to July 2018 Very Good to Good 5
Daily average PM 2.5 May 2017 to July 2018 Very Good to Good 6
Daily Maximum 1-hour Nitrogen Dioxide Gunnedah, March to July 2018 Very Good 7
Daily Maximum 1-hour Ozone Gunnedah, March to July 2018 Very Good to Good 8
Seasonal Weather and Climate Rainfall very much below average Maximum temperatures highest on record Intense Drought South-easterly winds uth-easterly winds 9
Regional Dust Storm 15 April 2018 24-hour PM 10 Poor to Very Poor Westerly winds Dust transported long-range with cold front 10
Gunnedah 14-21 July 2018 24-hour PM 2.5 Fair to Poor Peak 1-hour PM 2.5 overnight Very low temperatures and wind speeds overnight 11
Summary 90% Very Good to Good Local and regional sources affect air quality 12
Community reporting Online Air Quality Index and data Online Newsletter 13
Questions? Thank you 14
Recommend
More recommend