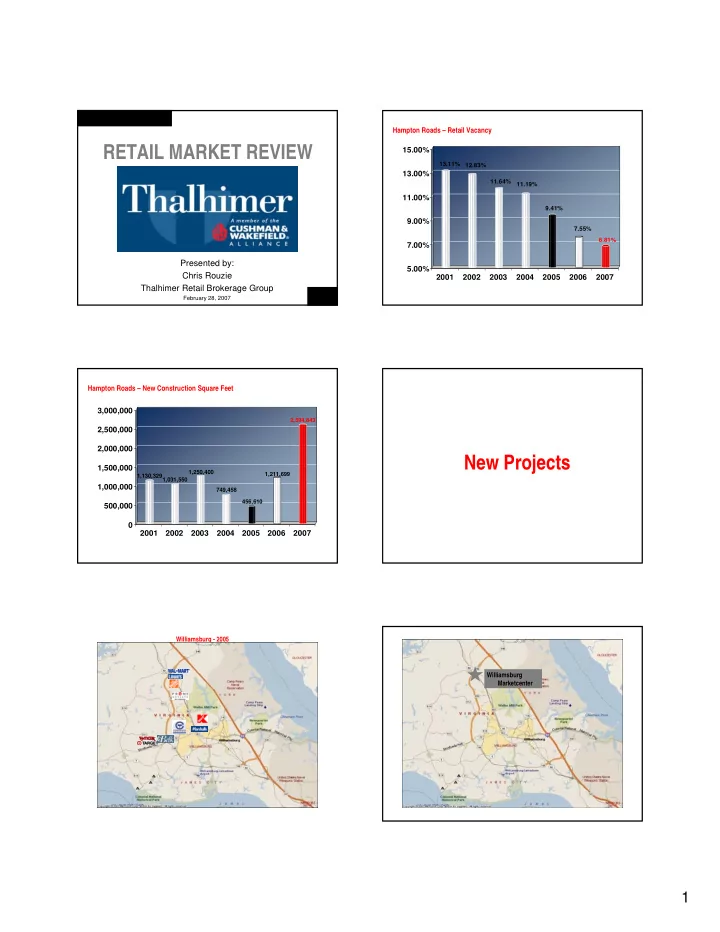

Hampton Roads – Retail Vacancy RETAIL MARKET REVIEW 15.00% 13.11% 12.83% 13.00% 11.64% 11.19% 11.00% 9.41% 9.00% 7.55% 6.81% 7.00% Presented by: 5.00% Chris Rouzie 2001 2002 2003 2004 2005 2006 2007 Thalhimer Retail Brokerage Group February 28, 2007 Hampton Roads – New Construction Square Feet 3,000,000 2,594,843 2,500,000 2,000,000 New Projects 1,500,000 1,250,400 1,211,699 1,130,3291,031,550 1,000,000 749,458 456,610 500,000 0 2001 2002 2003 2004 2005 2006 2007 Williamsburg - 2005 Williamsburg Marketcenter 1
Williamsburg Marketcenter New Town New Town & Settler’s Market New Town & Settler’s Market Settler’s Market New Town Marquis Development Marquis City Center 2
City Center Peninsula Town Center NetCenter Mercury Plaza Mercury Plaza Peninsula Town Center Edinburgh Proposed Edinburgh 3
Landstown Commons Landstown Commons Harbour View East Harbour View East Hampton Roads – Number of Stores in Region Food Lion 100 Farm Fresh 89 Supermarket Independent 80 Wal Mart Supercenter 60 Grocery Sector Kroger Harris Teeter 40 40 Fresh Pride 28 DECA Commissary 20 13 9 Super Kmart 8 6 6 4 2 0 Ukrops Source: Trade Dimensions 2006 CBSA 4
Hampton Roads – Grocery Group Market Share Food Lion – Bloom Store Wal Mart Food Lion 5% 2% 8% Farm Fresh 4% 1% 1% Supermarket Independent 4% 28% Fresh Pride Market Harris Teeter 22% Kroger DECA Commissary 25% Super Kmart Ukrops Source: Trade Dimensions 2006 CBSA Food Lion – Bottom Dollar Store Farm Fresh Haygood Shopping Center Bennett’s Creek The Market @ Harbor Heights Orchard Square Mt. Pleasant Marketplace Harris Teeter Expanding Footprint Ferrell Parkway Hanbury Village 5
RETAIL MARKET REVIEW Presented by: Chris Rouzie Thalhimer Retail Brokerage Group February 28, 2007 6
Recommend
More recommend