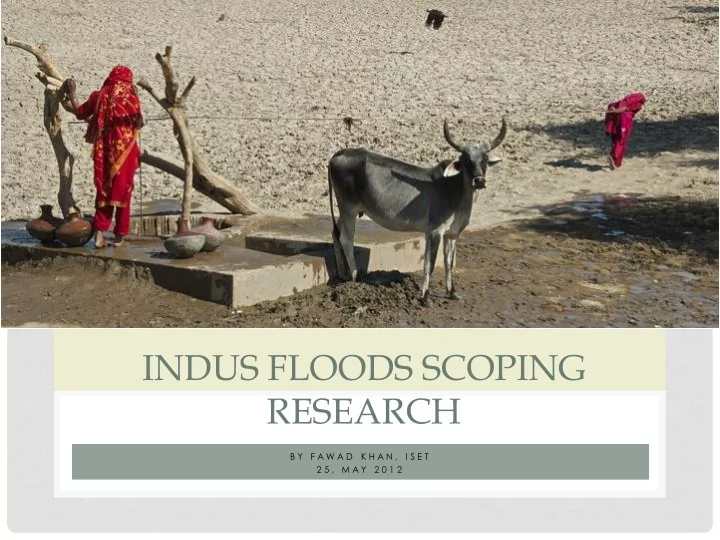

INDUS FLOODS SCOPING RESEARCH B Y F A W A D K H A N , I S E T 2 5 , M A Y 2 0 1 2
OVERVIEW OF FLOOD SCOPING STUDY • Results from the desk research • Field study sites • Methodology • Emerging Findings
2010 FLOOD RIVER FLOWS (NORTH TO SOUTH) 1,600,000 1,400,000 1,200,000 1,000,000 Cusecs 800,000 600,000 400,000 200,000 - Tarbela Kalabagh Chashma Taunsa Guddu Sukkur Kotri Designed capacity 1,500,000 950,000 950,000 1,100,000 1,200,000 1,500,000 875,000 Flood Record 510,000 950,000 786,600 788,646 1,199,672 1,166,574 981,000 Flood 2010 833,000 937,453 1,036,673 959,991 1,148,738 1,131,000 964,900
VULNERABILITY IN THE SYSTEM • Similar flows in 70’s floods • 5 million people affected vs 20 million • Population in 1976 = 73 mill. Vs 175 mill. In 2010 • What is the reason?
INTENSIVE RIVER MANAGEMENT • Annual flow deviation reduced • Inability to control development in riverbed/flood zone • North-South water flows • Changing weather patterns • No space for lateral flows (2011 floods)
CLOSED VS. OPEN BASIN Hydraulic Infrastructure Open Basin Management • Hardware • Low intensity high frequency events increase – Dams – Embankments – Autonomous response • Low intensity high – Technical support frequency events • Cost-benefit show similar reduced returns as embankments – Autonomous adaptation • How to identify and deliver ineffective adaptive capacities – People living in flood plains – Identify vulnerability • Low Frequency High – Build resilience through Intensity events increased gateway systems – People under false security
RESULTS FROM DESK RESEARCH • Flood was not unprecedented but damages were • Infrastructure and settlement patterns • Indus infrastructure not suited for lateral flows • Global examples from US, Thailand, India • Rebuilding risk • Open basin management • Social protection important for CC resilience • DRM institutions in disarray • How do we adapt and help build resilience of exposed communities?
ADAPTATION • Planned • Path dependence • Autonomous adaptation • Widespread • Works within weak institutions • How can we support it?
IDENTIFY FACTORS BUILDING RESILIENCE • Hypothesis: Availability, access and reducing fragility of systems and services builds resilience in communities • Use service availability as an indicator (census) • Identify socially vulnerable areas/populations • In post disaster situation identify vulnerable and resilient through recovery status (SLD/survey) • Document service availability differential between resilient and vulnerable • Identify critical services that build resilience
RESEARCH AREAS Chitral (mountainous) Charsadda (piedmont) Dadu (plane) Mithi (desert/coast)
PRELIMINARY RESULTS • Availability of credit and saving services are critical to recovery in Mithi • Land title is critical for recovery in Dadu • Number of years that electricity was available is important in Chitral • Sanitation is a critical differentiating factor in Dadu and Charsadda • Education and social capital is important across the board • Development inerventions can be prioritized to build resilience
THANK YOU
Recommend
More recommend