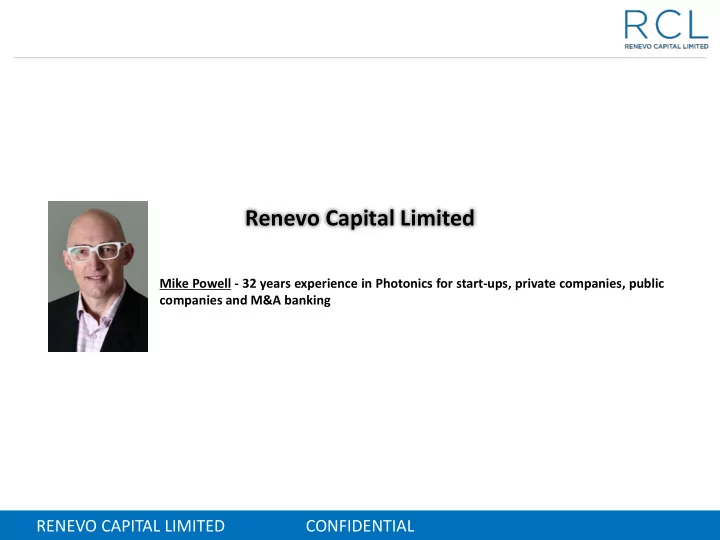

Renevo Capital Limited Mike Powell - 32 years experience in Photonics for start-ups, private companies, public companies and M&A banking RENEVO CAPITAL LIMITED CONFIDENTIAL
Who we are Research led investment bankers Over $10.5 billion in The Digital Stack transactions with growth technology companies Negotiation professionals with CONTENT, COMMERCE & SOCIAL backgrounds in industry and investment banking Apps, AdTech, Gaming CLOUD, PAAS & IAAS SYSTEMS APM, NPM, Security ENTERPRISE SOFTWARE SaaS, Analytics, BI ACESS DEVICES Smart Phones, IoT, Computers NETWORK INFRASTRUCTURE Systems, Modules, Embedded Software COMPONENTS Photonics , Semiconductors, Electronics Footprint in London, Silicon Valley and NEW MATERIALS AND PROCESSES Shanghai – majority of transactions are Nanotech, Printed Electronics cross-border RENEVO CAPITAL LIMITED CONFIDENTIAL
Market overview - photonics Regional distribution of photonic production volume (in $ bn) Other, Other, $28 $12 Other, China, Europe, China, China, Europe, $12 $129 $75 $25 $81 Europe, $70 $46 CAGR CAGR 2005 2011 2015 7.5% Japan, 6.3% $73 N. America, N. America, $247 $379 $484 N. America, $46 $66 $40 Japan, $81 Japan, Korea, Taiwan, Taiwan, $75 $29 $28 Korea, $44 Taiwan, $47 $51 Korea, $61 Consistent growth significantly above global GDP Source: Optech Consulting, Market Research Study 24.1.2017 Exchange rate 0.923 EUR = 1 USD RENEVO CAPITAL LIMITED CONFIDENTIAL
Market overview – photonics 10% Lighting 9% Displays and Lighting were the fastest Communication 8% Displays Defence & Security growing Photonics segment 2011-2015 – CAGR (2011-2015) 7% Information and Photovoltaics the lowest Medical Technology 6% Production Most segments grew faster than GDP with 5% Components & Systems the exceptions of Photovoltaics and Average global GDP Measurements 4% growth 2011-2015 Information 3% 2% The Displays segment dominates Information Photovoltaics 1% production volume and growth rate 0% $0 $20 $40 $60 $80 $100 $120 $140 Production volume in 2015 ($ bn) Source: Photonics21 / Eurostat / DB Research / Optech Consulting, Market Research Study 24.1.2017 RENEVO CAPITAL LIMITED CONFIDENTIAL
Photonics in mobility $89.4 bn in 2016 $10.0 bn in 2016 Research and Markets IHS Technology Switchgear Information Displays Key Sensors Photonics External $23.9 bn in 2016 Areas Lighting Stratistics $28.3 bn in 2016 Transparency Market Research Ambient Lighting $2.5 bn in 2016 Grand View Research RENEVO CAPITAL LIMITED CONFIDENTIAL
Automotive Imaging Sensors Camera $7.3 billion in 2016 Research and markets • Cameras depend on environnemental conditions 2 LiDAR Radar $390 million in 2016 $2.25 billion in 2016 Research and markets Grandview Research • LiDAR enables high precision • Radars provide no object detection in real time 2 detection 2 The automotive imaging sensor market predicted to grow at 23.73% CAGR between 2018 and 2022 1 Market Drivers: Rising number of Steady growth of Greater integration of Growing semi/fully Increasing automotive electronic components camera-based ADAS safety technologies in autonomous car production in cars market vehicles market 1 Research and Markets; 2 ewh.ieee.org RENEVO CAPITAL LIMITED CONFIDENTIAL
Photonics in mobility - LiDAR Production of Solid State and Flash LiDARs is expected to outpace mechanical LiDARs in 11 years Potential ADAS OEMs ADAS LiDAR shipment in million units 30 25 Volume in million units 20 15 10 5 0 All mechanical LiDAR (Munit) Solid-state and Flash LiDAR (Munit) Source: Yole Developpement RENEVO CAPITAL LIMITED CONFIDENTIAL
Photonics in mobility - LiDAR Autonomous vehicles will be able to construct a 3D map in high-speed conditions using distance gauging technology d Source: Yole Developpement RENEVO CAPITAL LIMITED CONFIDENTIAL
Photonics M&A & fundraising remains strong M&A deals (2010-2018 YTD) 5 5 4 4 4 4 3 3 3 2 2 2 2 2 2 2 1 1 1 1 1 1 1 1 1 1 1 1 2010 2011 2012 2013 2014 2015 2016 2017 2018 YTD $10m-$50m $50m-$100m $100m-$250m $250m+ • The majority of photonics M&A transactions are less than $100m in EV • The current environment is positive to sustain investment & M&A activity levels in 2018 11 Investment (2010-2018 YTD) 7 6 5 4 4 4 4 4 4 3 2 2 2 2 1 1 1 1 1 1 1 2010 2011 2012 2013 2014 2015 2016 2017 2018 YTD $1m-$5m $5m-$10m $10m-$25 $25m+ Source: 451 Research, press releases, Pitchbook RENEVO CAPITAL LIMITED CONFIDENTIAL
The current climate 2.0 M&A Ratio = Investment Four year moving average 1.0 0.0 2005 2006 2007 2008 2009 2010 2011 2012 2013 2014 2015 2016 2017 2018 RENEVO CAPITAL LIMITED CONFIDENTIAL
Emerging tech: Returns analysis Valuation Potential Mostly market access or financial value Cash Flow Mostly technology and strategic value Amount ($ millions) H G E F I C D B A A – Conception F – Market validation Time B – Ideation development G – Initial production C – Proof of concept H – First reoccurring revenue D – Market testing I – Maximum blocking to E – Alpha samples synergistic value RENEVO CAPITAL LIMITED CONFIDENTIAL
Selling or fundraising for your company The business proposition addresses a large, multi$B market opportunity The market is growing faster than GDP The business proposition is validated by the market Strong management team Strong IP/Patent ownership position Profit making, strong financials Cap table is not poisonous & shareholders have rational valuation expectations Low AML and KYC Risk, no current litigation RENEVO CAPITAL LIMITED CONFIDENTIAL
Recommend
More recommend