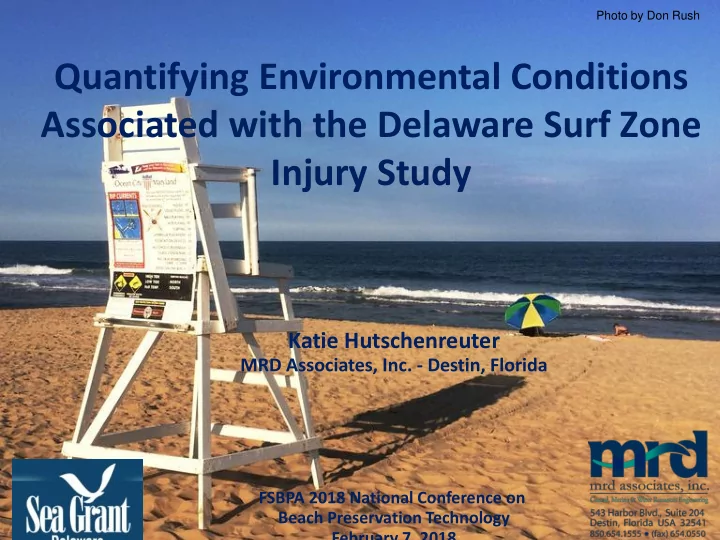

Photo by Don Rush Quantifying Environmental Conditions Associated with the Delaware Surf Zone Injury Study Katie Hutschenreuter MRD Associates, Inc. - Destin, Florida FSBPA 2018 National Conference on Beach Preservation Technology February 7, 2018
OUTLINE • Introduction to Surf Zone Injuries • Injury Statistics • Water Users and Injury Rates • Environmental Data • Results
SURF ZONE INJURIES What are surf zone injuries? • Injuries occurring due to breaking waves in the surf zone • Diving into shallow water • Injuries resulting from surfing, body boarding, etc. • Hydrodynamic-driven impact into shallow water as a result of beach activities
2014 STUDY • Location: Data was collected along the Atlantic coast of Delaware at 5 different beach locations • Time Frame: • Environmental Conditions collected between June 2 and August 22, 2014 (82 days) • Surf Zone Injury (SZI) data has been collected since 2010 * This study has continued through 2017 but I will only focus on the portion that I took part in, which only includes data through 2014.
2014 INJURY TOTALS • 280 total injuries during the 2014 summer • 169 injuries within 5 beach study area and 82-day time frame • 33 serious injuries (8 cervical fractures, 11 spinal cord injuries, and 1 fatality) • Up to 13 injuries occurred in a single day
2014 INJURY STATISTICS • 2:1 ratio of males injured relative to females • 6:1 ratio of tourists injured relative to locals • Average injury age was 32 years old • Top 5 Activities at time of injury: Number of Percent of Activity SZI SZI Total Wading 123 44 Body Surfing 55 20 Body Boarding 48 17 Skim Boarding 17 6 Dive Injuries 10 4
WATER USER COUNTS Three types of water user counts: • Daily Water User counts – once per day during peak hours along 100-m segment of each beach • Intraday Water User counts – 30-minute intervals between 9 am and 5 pm along 100-m segment of each beach • Beach Water User counts – Counted twice per summer over the entire length of each beach
INJURY RATE Injury rate calculated by dividing number of injuries by the total number of water users on a given day: • Mean Injury rate of 0.02% • Injury rate was greater than 0.05% on 12 days • Maximum injury rate of 0.12%
ENVIRONMENTAL PARAMETERS Environmental Parameters: • Beach Morphology • Wave Height • Peak Wave Period • Wave Direction • Wind Conditions Variations in Beach slope at Bethany beach for entire length of study
INJURY RELATION TO ENVIRONMENTAL CONDITIONS • Correlations between injury rate and environmental parameters were generally weak with the max correlation coefficient of 0.08 for significant wave height • Data was divided into injury rate=0, low injury rate (<0.05%), and high injury rate (>0.05%): • High Injury rate occurrence was greatest for moderate wave height days (Hs = 0.6 m) • Wave Height alone does not indicate when surf zone injuries are likely to occur “Delaware surf zone injuries and associated environmental conditions”, Puleo et Al., 2015
BEACH SAFETY AWARENESS • Surf zone injuries were not purely random suggesting a complicated relationship between human factors and underlying environmental conditions • Increased education on the possibility of surf zone injuries especially on shore break beaches similar to rip current awareness campaigns • Higher number of tourists injured relative to locals may suggest that these campaigns need to target visitors to be most effective
THANK YOU! http://corural.com/wp-content/uploads/2013/07/rehoboth-beach-delaware.jpg
Recommend
More recommend