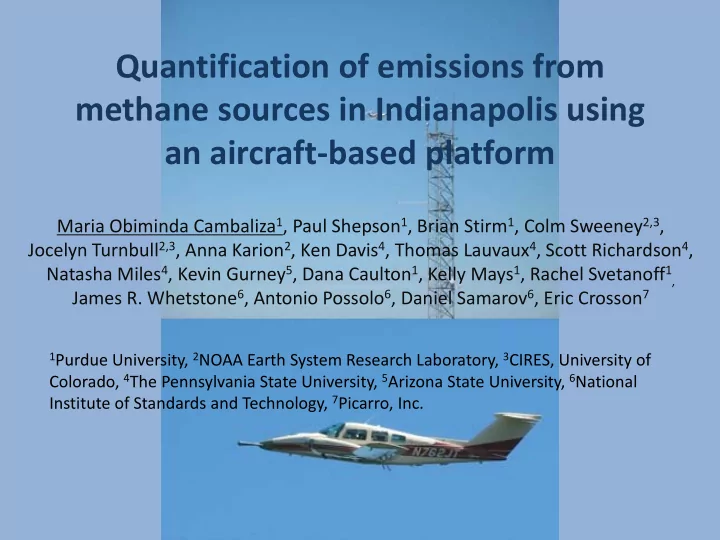

Quantification of emissions from methane sources in Indianapolis using an aircraft-based platform Maria Obiminda Cambaliza 1 , Paul Shepson 1 , Brian Stirm 1 , Colm Sweeney 2,3 , Jocelyn Turnbull 2,3 , Anna Karion 2 , Ken Davis 4 , Thomas Lauvaux 4 , Scott Richardson 4 , Natasha Miles 4 , Kevin Gurney 5 , Dana Caulton 1 , Kelly Mays 1 , Rachel Svetanoff 1 , James R. Whetstone 6 , Antonio Possolo 6 , Daniel Samarov 6 , Eric Crosson 7 1 Purdue University, 2 NOAA Earth System Research Laboratory, 3 CIRES, University of Colorado, 4 The Pennsylvania State University, 5 Arizona State University, 6 National Institute of Standards and Technology, 7 Picarro, Inc.
Background • global warming potential of 25 over a period of 100 years • Magnitude of individual sources of CH 4 is not well quantified • Urban environments are significant sources of anthropogenic methane emissions – significantly larger than currently estimated (Mays et al., 2009, Wunch et al., 2009) – Does not correlate with combustion sources (Mays et al., 2009) • Goals – Estimate the city-wide emission flux – Investigate and quantify source specific emissions – Carefully determine the magnitude of uncertainty
Experimental Set-up Purdue Airborne Laboratory for Atmospheric Research Cal 1 Cal Cal PFP 2 3 Calibration box Winds computer PCP CRDS
Experimental Sampling Design Top of the boundary layer edge
Flight Path: March 1, 2011 Indianapolis
Time series distribution of CO 2 and CH 4
Downwind Observed CH 4 distribution
Estimating the Emission Flux ( ) ∫ ∫ + x [ ] ij − C [ ] b z i F c = C * U ⊥ ij dxdz − x 0 F c : area-averaged emission flux (mols/s) -x and +x: min and max horiz transect distance limits corresponding to the area bounded by the city Uij: gridded wind vector perpendicular to the flight path dx and dz: horizontal and vertical grid spacing [C] b : ave background estimated from the edge of the transect
Interpolated CH 4 distribution Chu, D. The GLOBEC kriging software package – EasyKrig3.0; The Woods Hole Oceanographic Institution: 2004. Available from http://globec.whoi.edu/software/kriging/easy_krig/easy_krig.html (accessed November 2010)
Result of Flux Calculation Emission per capita, μmols s - Analytical population Emission, City year Technique density, per km 2 mols s -1 1 /person Mar 1 aircraft-based, 47 ± 14 57 ± 17 measurement Indianapolis 2011 CRDS 861 aircraft-based, 102 ± 73 123 ± 89 Mays et al., 2009 Indianapolis 2008 CRDS 861 South Coast air Wunch et al., Basin, Southern ground-based 1189 ± 198 121 ± 20 2009 CA 2007-2008 open path FTS 3168 ground-based GC and IRMS for [CH 4 ] and δ 13 C Lowry et al., 2001 London 1996 - 1997 measurement 4807 476 - 618 67 - 87
Revisiting the curtain transect CH 4 distribution
Interpolated CH 4 distribution
Back Trajectories
Following the plume upwind . . .
Interpolated CH 4 distribution ~55%
Revisiting the Downwind Observed CH 4 distribution
Back trajectories corresponding to hot spots from the East Indianapolis Caldwell Landfill
Horizontal flight segments on May 4, 2011
CH 4 Curtain Distribution vs Longitude
Interpolated CH 4 Curtain Flight Distribution
Calculating the Energy Equivalent from the Caldwell Landfill, Morristown, IN Estimated Flux = 9.1 mols s -1 = 821 m 3 hr -1 • 1 m 3 CH 4 has an energy content of 2.9 kWhr at 30% efficiency • 821 m 3 /hr * (2.9 kWhr/m 3 CH 4 ) = 2381 kWhr/hr • • From US EIA: In 2008, the average hourly electricity consumption for a US residential utility customer was 1.26 kWhr • Emissions from the Caldwell landfill can provide energy for approximately: – ~ 1890 households (at 30% efficiency) • Can provide energy for the city of Morristown which has a population of ~1400 We assume constant emission •
Summary and Future Work • Starting to gain better understanding of CH 4 sources and their magnitudes • Combine aircraft flux measurements with mobile surface measurements of CH 4 Combine aircraft measurements with a Lagrangian particle dispersion • model to determine the surface footprint corresponding to elevated CH 4 concentrations • Need flask measurements to further constrain the location of CH 4 sources Acknowledgement: Funding from NIST
Recommend
More recommend