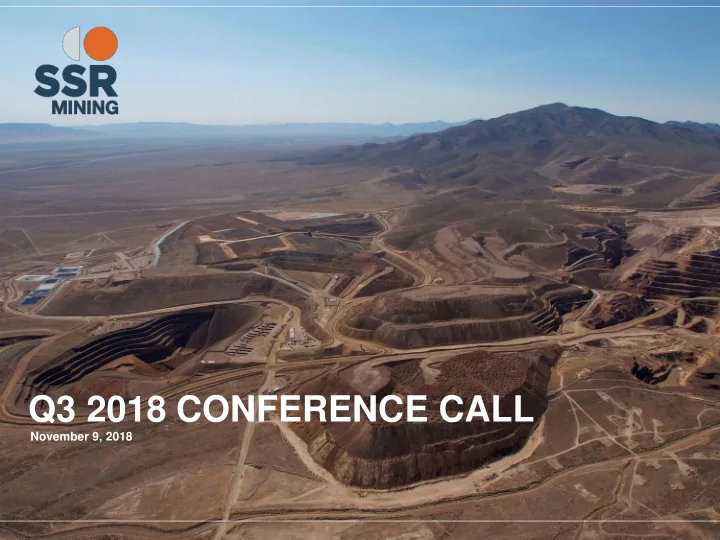

Q3 2018 CONFERENCE CALL November 9, 2018
Cautionary Notes SSRM:NASDAQ/TSX PAGE 2
Q3 2018: Delivered Our Strongest Quarter Year-to-Date Increased gold equivalent production to 95,000 ounces at lower cash costs Doubled operating cash flow and increased attributable earnings Achieved operating records at Marigold and Seabee Improved 2018 guidance Key milestones achieved at Chinchillas Exploration investments yielding results Strong cash balance of $475M Note: Cash costs is a non- GAAP financial measure. Please see “Cautionary Note Regarding Non- GAAP Financial Measures” in this presentation. SSRM:NASDAQ/TSX PAGE 3
Marigold Mine: Q3 2018 Results Produced 58,459 oz of gold, an 18% increase compared to Q2 Record material movement of 21.3M tonnes at lower mining costs of $1.51/t Positive impact from four new haul trucks Reported cash costs of $711/oz gold Reported AISC of $965/oz gold Improving 2018 cash cost guidance Note: Cash costs and AISC are non-GAAP financial measures. Please see "Cautionary Note Regarding Non- GAAP Measures” in this presentation. SSRM:NASDAQ/TSX PAGE 4
Seabee Gold Operation: Q3 2018 Results Record production of 27,831 oz of gold Mill throughput increased to 959 tonnes per day Record single day throughput of +1,440 tonnes Reported record cash costs of $447/oz gold Reported record AISC of $596/oz gold Improving 2018 production and cash cost guidance Note: Cash costs and AISC are non-GAAP financial measures. Please see "Cautionary Note Regarding Non- GAAP Measures” in this presentation. SSRM:NASDAQ/TSX PAGE 5
Puna Operations: Q3 2018 Results Produced 0.7M oz of silver, more than doubled zinc production to 3.2M lbs Successfully test processed Chinchillas ore, produced saleable concentrates Plant shutdown completed safely, under budget, and ahead of schedule Reported cash costs of $17.41/oz silver Reported AISC of $22.39/oz silver Note: Cash costs and AISC are non-GAAP financial measures. Please see "Cautionary Note Regarding Non- GAAP Measures” in this presentation. SSRM:NASDAQ/TSX PAGE 6
Chinchillas Project Development On Track Pre-stripping advancing as planned Key milestones: completed stockpile dome, road by-passes, power line upgrade Commercial production expected Q4 2018 Project remains on budget Pre-stripping activities advancing as planned Road by-passes operational Stockpile dome construction complete SSRM:NASDAQ/TSX PAGE 7
Marigold Exploration Update Focused on Mineral Resource Upgrade at Red Dot and Mackay A’ A EOY 2017 Mackay September 2018 Pit Original Surface EOY 2017 Reserve Pit Surface EOY 2017 Gold Resource Pit Shell grade model MRA6743 Gold Grade (g/t) 62.5 m at 1.45 g/t < 0.06 Incl. 10.7 m at 6.82 g/t 0.06 – 0.6 0.6 – 1.0 > 1.0 75 meters MRA6679 27.4 m at 1.68 g/t W E Note: Please see our news release dated November 6, 2018 for further details. SSRM:NASDAQ/TSX PAGE 8
Seabee Exploration Update Near-mine drilling at Santoy yielding significant results Santoy Gap (9A, 9B, 9C) Santoy 8A 0m Elev 3.2m at 32.2g/t (JOY-18-810) 2.6m at 27.5g/t (JOY-18-807) 4.1m at 17.0g/t (JOY-18-801) 4.8m at 12.0g/t (JOY-18-799) 2.7m at 18.4g/t 10.7m at 3.7g/t (JOY-18-772) Santoy (JOY-18-831) (HW) Gap HW 2.5m at 32.5g/t 3.7m at 8.2g/t (SUG-18-907) (SUG-18-624) (HW) 3.7m at 20.5g/t 4.1m at 25.6g/t (SUG-18-909) (SUG-18-622) (HW) 7.0m at 14.1g/t (SUG-18-943) 7.0m at 12.2g/t 1.9m at 37.6g/t (SUG-18-913) (SUG-17-058) 18.5m at 11.2g/t (SUG-18-941) 1.9m at 200.9g/t (JOY-13-690) 6.3m at 12.5g/t 4.8m at 12.3g/t (SUG-18-955) (SUG-18-612) (HW) >20 Gram-meters, Exploration Period 800m Elev <20 Gram-meters, Exploration Period 2.2m at 12.5g/t Previously Reported Drillholes (SUG-17-926) Measured & Indicated Mineral Resources Inferred Mineral Resources Mined Areas (Year-End 2017) Note: Please see our news release dated November 6, 2018 for further details. SSRM:NASDAQ/TSX PAGE 9
Santoy Gap Hanging Wall Recent drilling confirms discovery near existing infrastructure Note: Please see our news release dated November 6, 2018 for further details. SSRM:NASDAQ/TSX PAGE 10
Selected Financial Results for Q3 2018 Units Q3 2018 Q2 2018 Q3 2017 Gold Sales oz 88,787 67,156 60,616 Silver Sales Moz 0.6 1.1 2.1 Total Gold Equivalent Sales oz 96,760 81,595 88,029 Gold Equivalent Production oz 94,808 85,082 77,105 Revenue $M $115.0 $104.0 $106.0 Income from Mine Operations $M $21.8 $21.2 $22.5 Net Income $M $2.2 $2.6 $1.8 Attributable Net Income $M $6.4 $5.1 $1.1 Basic Attributable Earnings per share $ $0.05 $0.04 $0.01 Adjusted Attributable Net Income $M $10.8 $12.1 $4.4 Adjusted Basic Attributable Earnings per share $ $0.09 $0.10 $0.04 Cash Generated by Operating Activities $M $35.4 $17.1 $30.3 Notes: Silver sales and gold equivalent sales are on a 100% basis. Gold equivalent sales are based on total gold and silver sales and the realized silver and gold prices for each corresponding period. Realized metal prices, adjusted attributable net income and adjusted basic attributable earnings per share are non-GAAP financial measures. Please see "Cautionary Note Regarding Non- GAAP Measures” in this presentation. SSRM:NASDAQ/TSX PAGE 11
Financial Strength Continues to be an Advantage Units Q3 2018 Q2 2018 Cash $M $475 $494 Total Assets $M $1,504 $1,505 Current Liabilities $M $82 $88 Working Capital $M $649 $672 SSRM:NASDAQ/TSX PAGE 12
Delivering Growth and Value for Shareholders Delivered strong operating performance Solid financial performance with increased operating cash flow and attributable earnings Improved 2018 guidance On track to meet or exceed full year guidance for seventh consecutive year Exploration programs yielding significant results Robust growth outlook at all three operations SSRM:NASDAQ/TSX PAGE 13
SSR Mining Inc. www.ssrmining.com Toll-free: +1 888.338.0046 Telephone: +1 604.689.3846 Email: invest@ssrmining.com
Recommend
More recommend