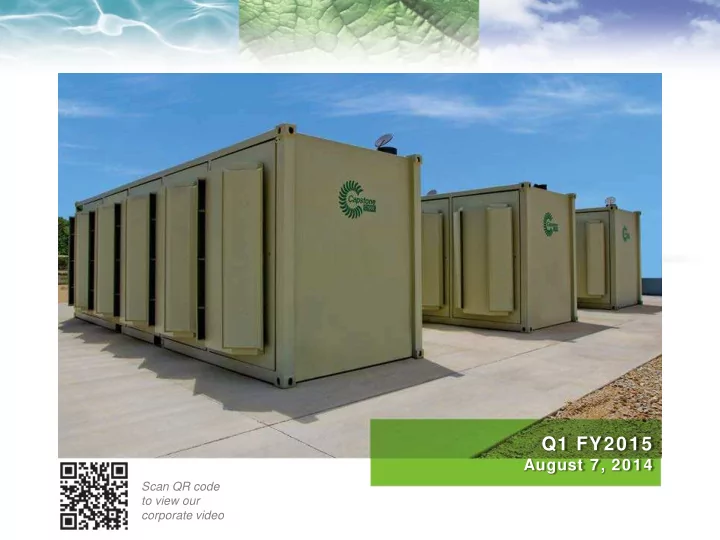

Q1 FY2015 August 7, 2014 Scan QR code to view our corporate video
Safe Harbor Statement This presentation contains "forward-looking statements," as that term is used in the federal securities laws, about growth and diversification of our end markets; increased production rates; strengthened distribution channels; ongoing new order flow; reduced cash usage; growth in revenue, gross margin and backlog; attaining profitability; improvement in certain key performance indicators and strategic initiatives; achievement of our EBITDA and cash goals; adequacy of capital resources; improved operating leverage; new product development; benefits from our cost reduction initiatives; opportunities in the Bakken shale play; growth of key markets; new certifications and compliance with government regulations. Forward-looking statements may be identified by words such as “expects," "objective," "intend," "targeted," "plan" and similar phrases. These forward-looking statements are subject to numerous assumptions, risks and uncertainties described in Capstone's Form 10- K, Form 10-Q and other recent filings with the Securities and Exchange Commission that may cause Capstone's actual results to be materially different from any future results expressed or implied in such statements. Because of the risks and uncertainties, Capstone cautions you not to place undue reliance on these statements, which speak only as of the date of this presentation. Capstone undertakes no obligation, and specifically disclaims any obligation, to release any revisions to any forward-looking statements to reflect events or circumstances after the date of this presentation or to reflect the occurrence of unanticipated events. "Capstone" and "Capstone MicroTurbine" are registered trademarks of Capstone Turbine Corporation. All other trademarks mentioned are the property of their respective owners. 1
First Quarter FY 2015 Highlights Revenue of $23.3 million Gross margin of $3.4 million, or 15% of revenue Record backlog of $175.2 million Cash balance of $46.7 million at 6/30/14 2
Margin Grow th Year-Over-Year 1Q Gross Margins 20% 15% 15% 14% 10% 8% 5% 2% 0% -3% -5% 1Q11 1Q12 1Q13 1Q14 1Q15 Seventh Consecutive Quarter of Double-Digit Gross Margin. 3
First Quarter FY 2015 1Q15 Quarter- Year-over- ended over- Year 6/30/14 Quarter Revenue $23.3 M -36% -5% Product revenue $17.6 M -41% -13% Gross margin 15% -200 bps +100 bps R&D expense $2.3 M -8% Flat SG&A expense $7.8 M +15% +3% Net loss ($6.8 M) +100% Flat 4
Megaw atts and Units Shipped Sales (MW) Sales (Units) C1000 5% C600 C800 C30 4% 1% 4% C30 22% C65 C200 26% C1000 9% 34% TA100 1% 17.9 MW, 125 Units, down 5% down 28% YOY YOY C600 17% C200 13% C30 4% C65 C65 26% 58% 5
Liquidity and Capital Resources Balance Sheet 6/30/14 3/31/14 Cash and cash equivalents $46.7 M $27.9 M Accounts receivable $24.2 M $28.0 M Inventories $25.4 M $21.0 M Inventory turns 3.4 5.3 Strong balance sheet with minimal debt. Cash Flows 1Q15 1Q14 Cash used in operating activities $9.1 M $15.9 M Capital expenditures $0.2 M $0.3 M 6
Product Backlog $ millions $200 $175.2 $180 $160 $140 $120 $100 $80 $60 $40 $20 $5.0 $0 FY2007 FY2008 FY2009 FY2010 FY2011 FY2012 FY2013 FY2014 1Q2015 Backlog has grown at a 66% annual rate over the last 7 years 7
Global Market Segments Vertical Markets by Geographic Markets by Product Shipments Revenue North America Critical Power Other Energy 52% Supply / Mobile 2% Efficiency 1% XX% Australia Renewable Natural Energy 5% Resource 5% Transportation Critical Power Applications Asia Products <1% Supply <1% 62% 8% Oil, Gas & Energy Renewable Europe Other Efficiency Energy 33% XX% 32% XX% 8
Microturbine Q1 Shipments by MW 9
Bakken Shale Area Vergent Power Solutions is a new distributor taking on the Bakken Shale Area in North Dakota As of 2013, Bakken produced more than 10% of all U.S. oil production Energy Efficiency Other XX% 6% Renewable The Bakken shale area produces an abundance of Australia Energy gas flaring 4% 5% Transportation Critical Power Products <1% Supply <1% Oil, Gas & Renewable Capstone Microturbines are an ideal solution for Other Energy flare gas XX% XX% 10
Research & Development • Strategic public/private partnership with the DOE to develop next generation products – Finalizing C370 architecture – Successfully completed 3000 hour elevated temperature test with AFA material • New European regulatory changes for grid interconnection – Initial certifications planned later this year
Recommend
More recommend