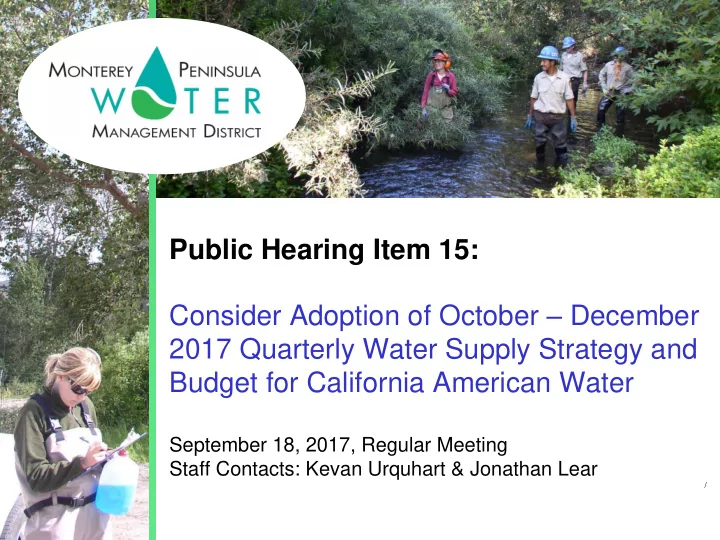

Public Hearing Item 15: Consider Adoption of October – December 2017 Quarterly Water Supply Strategy and Budget for California American Water September 18, 2017, Regular Meeting Staff Contacts: Kevan Urquhart & Jonathan Lear /
CALIFORNIA AMERICAN WATER QUARTERLY WATER SUPPLY BUDGET: October - December 2017 Consistent with SWRCB Orders 95-10, 98-04, 2002-02, and 2016-0016, Seaside Groundwater Basin adjudication decision, and District Rule 160 targets. Assumes Water Projects 1 & 2 (ASR) permits will not allow additional diversion until December. Diversions to date in the last Water Year 2017 stored 2,345 AF & intend to recover ~1,488 AF. Assumes mean monthly inflow conditions characteristic of a Wet Water Year Type (WYT) though September, than a Normal WYT through December 2017. 2
CALIFORNIA AMERICAN WATER QUARTERLY WATER SUPPLY BUDGET: October - December 2017 Includes ongoing level of reductions in Carmel River System diversions per Order WR 2016-0016, and the latest triennial reductions from the Seaside Basin per the adjudication. Assumes full utilization of all legally available native Seaside Basin groundwater during Water Year 2018. Assumes none of the remaining 857 acre-feet of ASR storage from WY 2017 will be used in the first quarter of WY 2018. Developed cooperatively by MPWMD, Cal-Am, California Department of Fish and Wildlife (CDFW), and the National Marine Fisheries Service (NMFS), on September 12, 2017. 3
CAL-AM QUARTERLY WATER SUPPLY BUDGET: MAIN SYSTEM PRODUCTION TARGETS October to December 2017 Proposed Production Targets for the Main System in Acre Feet SOURCE/USE MONTH Oct-17 Nov-17 Dec-17 Source Carmel Valley Aquifer Upper Subunits (95-10) 0 0 100 Lower Subunits (95-10) 446 281 419 Lower Subunits (ASR) 0 0 145 Upper & Lower (Table 13) 0 0 24 Total 446 281 688 Seaside Groundwater Basin Coastal Subareas 350 350 100 ASR Recovery 0 0 0 Sand City Desalination 25 25 25 Total 375 375 125 Use Customer Service (95-10 & SGB) 821 656 644 ASR Injection 0 0 145 Customer Service (Table 13) 0 0 24 4 Total 821 656 813
CAL-AM QUARTERLY WATER SUPPLY BUDGET: LAGUNA SECA SUBAREA SYSTEMS PRODUCTION TARGETS October to December 2017 Proposed Production Targets for the Satellite Systems in Acre Feet SOURCE/USE MONTH Oct-17 Nov-17 Dec-17 Source Seaside Groundwater Basin Laguna Seca Subarea 0 0 0 Other 0 0 0 Use Customer Service 0 0 0 5
2017 Low Flow MOA Update Table 1 [Version 1g] - 9/12/17 2017 Low Flow Memorandum of Agreement & Quarterly Water Budget Los Padres Reservoir: Release Schedule (All Values in Acre-Feet, except Cubic-Feet-per-Second as indicated) Assuming July-September Flows at 92% of WYs 2010-2011, Then Median Normal WYT Flows for October-December, and Drawdown No Lower Than 1000' Elevation = 378 AF (New 2017 Tables) Month Represents Water Year Type of: Wet Normal BelowNorm ExtWet ExtWet AboveNorm AboveNorm ExtWet ExtWet ExtWet ExtWet AboveNorm Normal Normal Normal Oct-16 Nov-16 Dec-16 Jan-17 Feb-17 Mar-17 Apr-17 May-17 Jun-17 Jul-17 Aug-17 Sep-17 Oct-17 Nov-17 Dec-17 WY 2017 Los Padres Reservoir Estimated Inflow 518 804 2,760 41,973 46,035 13,060 9,837 4,461 2,300 1,196 735 480 333 752 2,324 124,159 Evaporation 20 5 2 16 16 34 21 42 50 46 49 44 19 11 2 345 Outflow as @ BLP Gage Spillage 0 0 1,233 41,035 45,186 12,104 8,923 3,497 1,357 0 0 0 0 0 85 113,335 Combined Release (Ladder/Trap/980') 832 860 832 982 10,191 445 549 922 922 833 922 893 922 893 1150 908 Actual Mean Daily in CFS @ BLP Gage 7.2 8.9 35.0 682.4 748.4 211.8 159.6 71.9 37.8 18.7 14.8 14.0 14.0 14.0 17.4 Targeted Min. Mean Daily Flow in CFS 7 10 15 n/a n/a n/a n/a n/a n/a n/a 15.0 14.0 14.0 14.0 14.0 Total Storage Beginning of Month 869 922 1,172 1,775 1,775 1,775 1,775 1,775 1,775 1,667 1,667 1,445 1,049 503 412 End of Month 922 1,172 1,775 1,775 1,775 1,775 1,775 1,775 1,775 1,667 1,445 1,049 503 412 1,667 Between Reservoirs Net Inflow from Tributaries 116 278 653 26,966 29,138 7,305 3,586 2,271 970 450 242 49 18 84 581 72,024 All Estimated Losses (Div. + E.T.) 0 0 0 0 0 0 0 0 0 0 58 53 37 21 16 111 Sleepy Hollow Weir Total Estimated Release 561 827 2,808 68,923 75,157 20,331 13,402 6,690 3,220 1,600 1,092 828 841 895 1,632 195,439 Estimated Mean Daily Flow in CFS 9.1 13.9 45.7 1120.9 1353.3 330.7 225.2 108.8 54.1 26.0 17.8 13.9 13.7 15.0 26.5 Notes: 1. The minimum pool requirement at Los Padres Reservoir is 105 acre-feet at elevation 980 ft. 2. Projected inflows for the July - September 2017 period are based on actual 2010 flows reduced 8%. 3. Projected inflows for the October - December 2017 period are deived from the median flows @ Sleepy Hollow Weir for a Normal WYT based on 1902-2015 data. 4. Inflows are apportioned Above and Below LPD, as actually occured in July - September 2010, then 95/5% in October, 90/10% in November, and 80/20% in December. 5. Estimated evaporation from LPR in July-December are actual measured values from 2010. 6. Releases and diversions are consistent with terms of the 2001 and 2006 Conservation Agreements between the NMFS and Cal -Am and with the conditions in SWRCB Order Nos. 95-10, 98-04, 2002-0002, and 2016-0016. 7. Numbers in Bold type are final reported numbers, and those in Italic s are future estimates. 8. LPR storage values based on preliminary results from the 2017 Bathymetric Survey of LPR, beginning July 1, 2017; max capac ity@ 1039.78' = 1,667 AF. 6
CALIFORNIA AMERICAN WATER QUARTERLY WATER SUPPLY BUDGET: October - December 2016 Recommendation Adopt proposed water supply strategy and budget for Cal- Am’s Main and Laguna Seca water distribution systems for the first quarter of Water Year 2018, the October - December 2017 period. 7
Recommend
More recommend