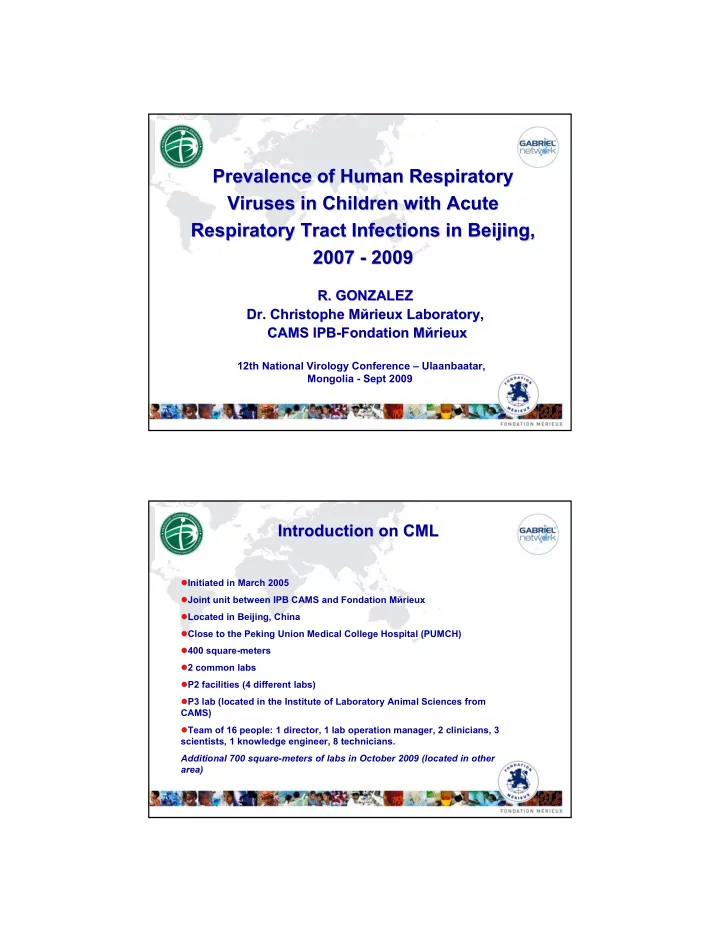

Prevalence of Human Respiratory Prevalence of Human Respiratory Viruses in Children with Acute Viruses in Children with Acute Respiratory Tract Infections in Beijing, Respiratory Tract Infections in Beijing, 2007 - - 2009 2009 2007 R. GONZALEZ R. GONZALEZ Dr. Christophe M Dr. Christophe M й й rieux rieux Laboratory, Laboratory, CAMS IPB CAMS IPB- -Fondation Fondation M M й й rieux rieux 12th National Virology Conference – Ulaanbaatar, Mongolia - Sept 2009 Introduction on CML Introduction on CML � Initiated in March 2005 � Joint unit between IPB CAMS and Fondation M й rieux � Located in Beijing, China � Close to the Peking Union Medical College Hospital (PUMCH) � 400 square-meters � 2 common labs � P2 facilities (4 different labs) � P3 lab (located in the Institute of Laboratory Animal Sciences from CAMS) � Team of 16 people: 1 director, 1 lab operation manager, 2 clinicians, 3 scientists, 1 knowledge engineer, 8 technicians. Additional 700 square-meters of labs in October 2009 (located in other area)
Main missions of CML Main missions of CML � A key player contributing to China’s emergency response against infectious diseases. � Investigations on etiology and epidemiology of viral respiratory infections in Chinese population � Development of technology platforms for unknown virus identification and discovery of unknown respiratory viruses in ARTI samples � Development of new diagnosis and intervention technologies based on systems biology � Providing training to GABRIEL network partners from low-income countries Achievements � First large comprehensive investigation on etiology of adult ARTIs in China (CMI journal, Oct 2008) � First identification of group C rhinovirus in China (EID journal, Oct 2008) � First report on Saffold cardiovirus in China (EID journal, May 2009) � First detection of WU polyomavirus in China (EID journal, Jan 2009) Respiratory sample screening Respiratory sample screening Nasopharyngeal aspirate blood Molecular tests Real-time NASBA PCR or RT-PCR Child patient from BCH (Beijing Children Hospital) Method Virus detected Respiratory syncytial virus (RSV), Influenza A&B, Human 1 NASBA Metapneumovirus (hMPV), Enterovirus Multiplex RT nested- 2 Parainfluenza virus1, 2, 3, and 4, Enterovirus, Rhinovirus PCR Multiplex RT nested- 3 Influenza A+B, RSV A & B PCR 4 One-step RT-PCR Human coronavirus (OC43, 229E, NL63, and HKU1), hMPV 5 PCR Adenovirus, Human Bocavirus
Seasonal distribution of Seasonal distribution of respiratory viruses in children respiratory viruses in children from BCH from BCH IFVA hMPV HCoV EV Adv IFVB HBoV HPIVs HRV RSV Mar Apr May Jun Jul Aug Sep Oct Nov Dec Jan Feb Mar Apr May Jun Jul Aug Sep Oct Nov Dec Jan Feb Mar Apr 2009 2007 2008 Respiratory viruses distribution Respiratory viruses distribution according to the age group according to the age group Age groups <6m ≥ 6-12m ≥ 1-2y ≥ 2-5y ≥ 5-10y ≥ 10y Total Patients tested 597 248 181 173 220 105 1524 Positive patients 488 (81.7) 209 (84.3) 155 (85.6) 117 (67.6) 76 (34.5) 22 (21.0) 1067 (70.0) Negative patients 99 (16.6) 39 (15.7) 26 (14.4) 56 (32.4) 144 (65.5) 83 (79.1) 447 (29.3) Co-detection cases 171 (28.6) 98 (39.5) 54 (29.8) 36 (20.8) 11 (5.0) 1 (1.0) 371 (24.3) RSV 339 (56.8)* 108 (43.4)* 50 (27.6) 39 (22.5) 17 (7.7) 1 (1.0) 554 (36.4) HRV 194 (32.5)† 87 (35.1)† 58 (32.0)† 41 (23.7) 28 (12.7) 13 (12.4) 421 (27.6) PIV 74 (12.4) 47 (19.0)† 37 (20.4)† 23 (13.3) 7 (3.2) 3 (2.9) 191 (12.5) IFVA/B 23 (3.9) 15 (6.1) 17 (9.4) 27 (15.6)* 22 (10.0) 2 (1.9) 106 (7.0) AdV 21 (3.5) 17 (6.9) 14 (7.7) 12 (6.9) 7 (3.2) 1 (1.0) 72 (4.7) COV 20 (3.4) 15 (6.1) 14 (7.7) 6 (3.5) 3 (1.4) 1 (1.0) 59 (3.9) HBoV 11 (1.8) 23 (9.3) 18 (9.9) 3 (1.7) 1 (0.5) 0 56 (3.7) hMPV 11 (1.8) 13 (5.2) 9 (5.0) 7 (4.1) 2 (0.9) 0 42 (2.8) EV 8 (1.3) 6 (2.4) 3 (1.7) 6 (3.5) 3 (1.4) 2 (1.9) 28 (1.8) # Percentage * p <0.01 † p <0.05
Co- -detection rate of respiratory detection rate of respiratory Co viruses according to the age group viruses according to the age group Age groups < 6m 6-<12m 1-<2y 2-<5y 5-<10y ≥ 10y Total Patients 597 248 181 173 220 105 1524 tested Co-detected 171 (28.6) 98 (39.5) 54 (29.8) 36 (20.8) 11 (5.0) 1 (1.0) 371 (24.3) cases (%) Multiple viruses detection Multiple viruses detection � Most frequent co-detections � RSV+HRV (especially in children under 6 months old) � Followed by RSV+PIV (also more frequent in children under 6 months old) � Triple co-detections quite frequent � 7 cases of 4 viruses co-detections � Most of them observed in young children (under 6 months old) • HRV+RSV+IFVA+CoV • HRV+RSV+PIV+CoV • HRV+RSV+AdV+HBoV • HRV+RSV+AdV+hMPV • HRV+RSV+CoV+hMPV • HRV+RSV+PIV+HBoV • PIV+RSV+AdV+HBoV
Distribution of HPIVs HPIVs infections infections Distribution of according to the age group according to the age group 16 HPIV1 14 HPIV2 HPIV3 12 HPIV4 Detection rate% 10 8 6 4 2 0 < 6m 6-<12m 1-<2y 2-<5y 5-<10y ≥ 10y total Seasonality of HPIVs Seasonality of HPIVs infections infections 50 HPIV1 45 HPIV2 40 HPIV3 Detection rate% HPIV4 35 HPIVs 30 25 20 15 10 5 0 Mar Apr May Jun Jul Aug Sep Oct Nov Dec Jan Feb Mar Apr May Jun Jul Aug Sep Oct Nov Dec Jan Feb Mar Apr 2007 2008 2009
Distribution of HCoVs HCoVs infections infections Distribution of according to the age group according to the age group Age groups < 6m 6-<12m 1-<2y 2-<5y 5-<10y ≥ 10y Total Tested patients 597 248 181 173 220 105 1524 HCoV positive patients 20 15 14 6 3 1 59 OC43 5 4 1 2 1 1 14 229E 1 0 6 0 0 0 10 HKU1 2 2 2 0 1 0 10 NL63 3 8 7 0 0 0 18 Untyped 4 1 1 1 7 Thank You ! Thank You !
Recommend
More recommend