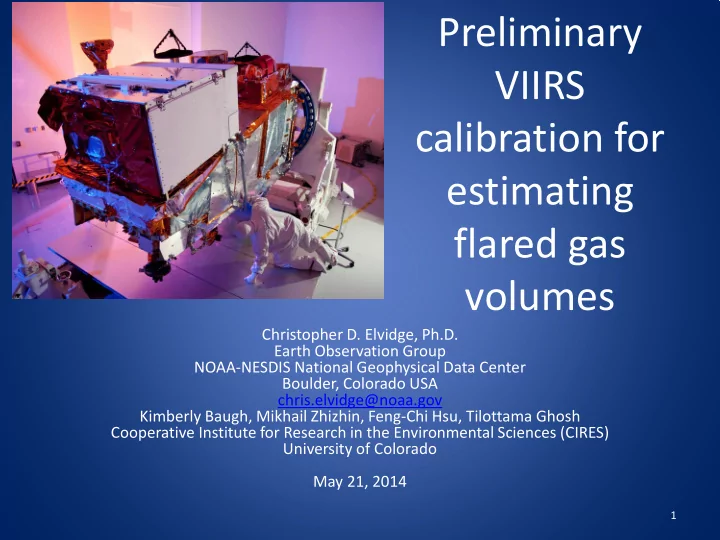

Preliminary VIIRS calibration for estimating flared gas volumes Christopher D. Elvidge, Ph.D. Earth Observation Group NOAA-NESDIS National Geophysical Data Center Boulder, Colorado USA chris.elvidge@noaa.gov Kimberly Baugh, Mikhail Zhizhin, Feng-Chi Hsu, Tilottama Ghosh Cooperative Institute for Research in the Environmental Sciences (CIRES) University of Colorado May 21, 2014 1
VIIRS • The Visible Infrared Imaging Radiometer Suite (VIIRS) is the primary imaging sensor flown on the NASA/NOAA Suomi National Polar Partnership satellite. • Launched on October 28, 2011, VIIRS began to collect usable data in late-February 2012. • 22 spectral channels, most with 750 meter pixels at nadir. • 3000 km swath. Overpasses at ~01:30 and 13:30 daily. • VIIRS is unique for collecting near and short-wave infrared data at night. 2
M11 Requested 3
Gas flares are readily detected in the VIIRS M10 spectral band 4
Nighttime data processed on 24 hour increments Typical gas flare detection Daily files are in csv and kmz formats 5
Detection Limits M13 M10 6
How to assemble a preliminary estimate for 2012? Five nights per month. Account for cloud obscuration using the VIIRS cloud product. Account for intermittent flaring by checking all cloud-free observations for detection. Filter to remove biomass burning and non-flare sources. Retain features 1400 K and hotter on land, 1000 K on water. Normalize for latitudinal variation in pixel area. Estimate flared gas volume for individual flares and countries. Generate ranked lists for flares and countries. 7
Total number of coverages 8
Cloud-free coverages 9
Calibration based on monthly reported data Annual BCM = 0.08306 * Average M10 radiance R 2 = 0.90 N = 840 10
Total 2012 flared gas volume estimated at 165 BCM (preliminary) 11
The largest single gas flare is in Venezuela 12
Are the results affected by atmospheric differences? Not much! M10 is in a very clear atmospheric window, with near 90% transmissivity worldwide. 13
Summary • VIIRS is well suited for global monitoring of gas flares. – Global data collected every day – Spectral band centered on peak radiant emission from flares is collected at night – That band is in one of the clearest atmospheric windows – Suite of spectral bands provides for cloud product and measurement of cloud optical thickness • The preliminary estimates for 2012 find: – 165 BCM total – Iraq is the country with the most flaring, followed by Russia, Iran, Venezuela, Algeria and Nigeria. • Why are VIIRS estimates different from DMSP? – No signal saturation on VIIRS – DMSP could not distinguish light from flare and facility • Next steps: – Add larger flares to calibration – Develop automated approach to discriminate clear versus cloud impacted flares based on the width of spikes – Fill out the processing for all dates in 2012, 2013, 2014 – Improve the separation of flares and fires using temporal leverage – Other next steps………… 14
Data Access • Daily data (all detections): http://ngdc.noaa.gov/eog/viirs/download_viirs_fire.html • Daily data (flares only): http://ngdc.noaa.gov/eog/viirs/download_viirs_flares_o nly.html • Results on gas flaring (annual composite, spreadsheets, flare rankings): http://ngdc.noaa.gov/eog/viirs/vnf_flaring_cal_n_est.html 15
Reference Elvidge, C.D.; Zhizhin, M.; Hsu, F.-C.; Baugh, K.E. VIIRS Nightfire: Satellite Pyrometry at Night. Remote Sens. 2013, 5, 4423-4449. doi:10.3390/rs5094423 16
Recommend
More recommend