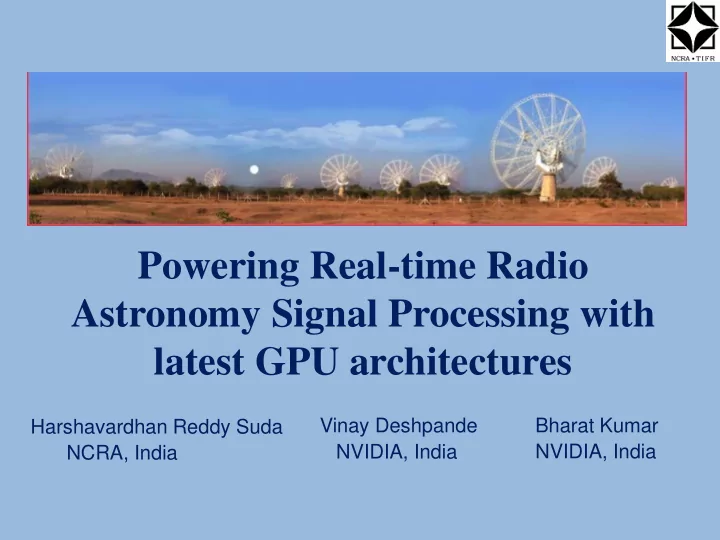

Powering Real-time Radio Astronomy Signal Processing with latest GPU architectures Vinay Deshpande Bharat Kumar Harshavardhan Reddy Suda NVIDIA, India NVIDIA, India NCRA, India
What signals we are processing? ▪ Digitized baseband signals from 30 dual polarized antennas of GMRT GMRT ▪ The Giant Meter-wave Radio Telescope (GMRT) is a world class instrument for studying astrophysical phenomena at low radio frequencies ▪ Located 80 km north of Pune, 160 km east of Mumbai ▪ Array telescope with 30 antennas of 45 m diameter, operating at meter wavelengths
GMRT ▪ Supports two modes of operation : - Interferometry (correlator) - Array mode (beamformer) ▪ Frequency bands : - 130 to 260 MHz - 250 to 500 MHz - 550 to 900 MHz - 1050 to 1600 MHz ▪ Maximum instantaneous bandwidth : 400 MHz (Legacy GMRT = 32 MHz) ▪ Effective collecting area (2-3% of SKA) -30,000 sq m at lower frequencies -20,000 sq m at higher frequencies
The Giant Meter-wave Radio Telescope A Google eye view
GMRT receiver chain Signal processing in digital back-end Image courtesy : Ajith Kumar, NCRA
Computation requirements Antenna Signals(M=64) Sampler Maximum Bandwidth 400 MHz 16k point spectral channels – Fourier Transform O(NlogN) 3 TFlops Phase 0.1 TFlops Correction MAC 6.6 TFlops M(M+1)/2 Total ~ 10 TFlops
Design : Time slicing model
Design : Time slicing model A 4-node example Ant 1, Ant 2 --- Ant 16 : Digitized data of baseband signals of Antennas
Implementation ▪ 16 Dell T630 machines as Compute Nodes ▪ 16 ROACH (FPGA) boards with Atmel/e2v based ADCs developed by CASPER group, Berkeley for digitization and packetization ▪ 32 Tesla K40c GPU cards for processing ▪ 36 port Mellanox Infiniband switch for data sharing between Compute Nodes and Host Nodes ▪ Software : C/C++ and CUDA C programming with OpenMPI and OpenMP directives ▪ Developed in collaboration with Swinburne University, Australia
Implementation Image courtesy : Irappa Halagalli, NCRA
Sample result Image of Coma cluster Upgraded GMRT 300 – 500 MHz : Legacy GMRT 325 MHz : 350 μ Jy 28 μ Jy Significantly lower noise RMS and better image quality with upgraded GMRT Dharam Vir Lal and Ishwar Chandra, NCRA
Computation Performance : K40 FFT MAC Channels (Gflops) (Gflops) 2048 620 626 4096 626 620 8192 512 574 16384 498 537 No. of antennas : 32 (dual pol) CUDA 7.5
Motivation for next generation GPUs ▪ Adding more compute intensive applications - Multi-beamforming - Processing on each beam (beam steering) - Gated correlator - FIR filtering with many taps for narrow-band mode implementation ▪ Working GMRT system and code provides an excellent testing ground for the features of next generation GPUs ▪ Performance measured and compared on GP100 and V100
Computation performance – K40 vs GP100 Cuda 7.5, ECC off Performance follows CUFFT benchmarks for K40 and P100 Reference for K40 benchmark : CUDA 6.5 performance report, September 2014 Reference for P100 benchmark : CUDA 8 PERFORMANCE OVERVIEW, November 2016
Computation performance : K40 vs GP100 Cuda 7.5, ECC off No. of antennas : 32 (dual pol)
Computation performance : K40 vs GP100 Cuda 7.5, ECC off Peak Performance : Peak Global Memory Bandwidth : K40 – 4.3 TFlops K40 – 288 GB / sec GP100 – 9.3 TFlops GP100 – 732 GB / sec
Computation performance as % of Real-time Bandwidth : 200 MHz No. of antennas : 32 (dual pol) Spectral Channels : 16384
Computation performance : GP100 vs V100 GP100 on Cuda 7.5 V100 on Cuda 9.1 (using PSG cluster)
Computation performance : GP100 vs V100 GP100 on Cuda 7.5 V100 on Cuda 9.1 (using PSG cluster) No. of antennas : 32 (dual pol)
Computation performance : GP100 vs V100 GP100 on Cuda 7.5 V100 on Cuda 9.1 (using PSG cluster) Peak Performance : Peak Global Memory Bandwidth : GP100 – 9.3 TFlops GP100 – 732 GB / sec V100 – 14 TFlops V100 – 900 GB / sec
Reasons behind relatively low performance of MAC ▪ Non-contiguous Global Memory access at block level MAC input data format ▪ Low Arithmetic Intensity
GPU kernel improvements ▪ FFT : Single Precision to Half Precision floating point ▪ MAC : Simplified Index Arithmetic Improved the L2 hit ratio : less then 5% to nearly 86% Vectorized loads – Increased ILP (float4) Exposing more parallelism by increasing the occupancy Single Precision to Half Precision floating point – No performance gain
MAC : Performance gain with optimizations on V100 V100 on Cuda 9.1 (using PSG cluster) No. of antennas : 32 (dual pol)
FFT : Performance gain with half precision on V100 V100 on Cuda 9.1 (using PSG cluster)
FFT : Error analysis with half precision in power spectrum Spectral Channels : 2048 Batch size : 128
FFT : Error analysis with half precision in phase spectrum Spectral Channels : 2048 Batch size : 128
Going forward ▪ Improving MAC using Tensor cores – potential 2x improvement ▪ Implementing the MAC optimizations and half-precision floating point FFT in the GMRT code ▪ Optimized FIR filtering routines in CUDA for narrow-band mode implementation ▪ Implementing multi-beamforming, beam steering and gated correlator
Acknowledgements ▪ Prof. Yashwant Gupta, Centre Director, NCRA ▪ Ajith Kumar B., Back-end group co-ordinator, GMRT, NCRA ▪ Sanjay Kudale, GMRT, NCRA ▪ Shelton Gnanaraj, GMRT, NCRA ▪ Andrew Jameson, Swinburne University, Australia ▪ Benjamin Barsdel, Swinburne University, Australia (now at Nvidia) ▪ CASPER Group, Berkeley ▪ Digital Back-end Group, GMRT, NCRA ▪ Computer Group, GMRT, NCRA ▪ Control Room, GMRT
Thank You
Recommend
More recommend