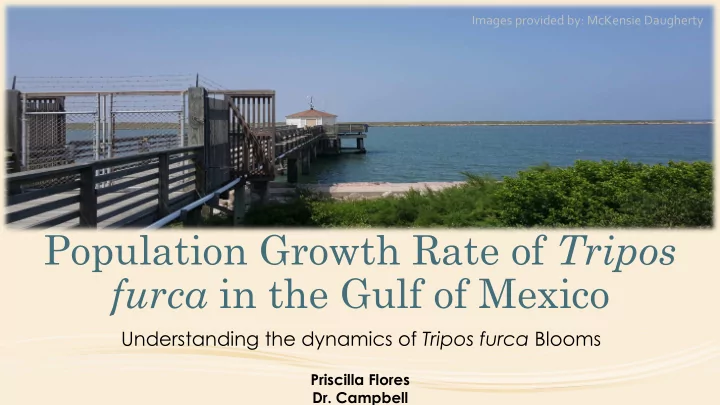

Images ¡provided ¡by: ¡McKensie ¡Daugherty ¡ Population Growth Rate of Tripos furca in the Gulf of Mexico Understanding the dynamics of Tripos furca Blooms Priscilla Flores Dr. Campbell
Tripos furca FWC ¡Fish ¡and ¡Wildlife ¡Research ¡Institution ¡ ¡ • Phytoplankton-Dinoflagellate • Ranges from 80-100 micrometers • Disruptive Algal Blooms • Causes oxygen deficiencies • Brown discoloration of water http://toast.tamu.edu/IFCB7/dashboard/http://toast.tamu.edu/IFCB7/D20130616T094005_IFCB007 ¡
Imaging FlowCytobot (IFCB) • Location: Port Aransas, TX • Combines video and flow cytometric technology to capture images of nano- and microplankton • Time series with samples collected every 20 minutes • Measures chlorophyll fluorescence associated with each image • Identifies many organisms to genus or species level ¡ ¡ Images ¡provided ¡by: ¡McKensie ¡Daugherty ¡
Phased cell division Dinophysis ¡ Dividing ¡cells ¡ Hour after midnight Fig.5 Campbell et al. 2010
Research Question 1: Does Tripos furca undergo phased cell division? • Hypotheses: We hypothesize that Tripos furca does undergo phased cell division • and that the peak of division occurs after midnight. Experimental Design: We will be using the frequency of dividing cells observed • from classified files of Tripos furca over a 24hr cycle. http://toast.tamu.edu/IFCB7/dashboard/http://toast.tamu.edu/IFCB7/D20130616T094005_IFCB007 ¡
Stages of Tripos furca cell division
Tripos furca bloom June 2013 ¡ 200 ¡ 180 ¡ 160 ¡ 140 ¡ Dividing ¡cells ¡ 120 ¡ 100 ¡ 80 ¡ 60 ¡ 40 ¡ 20 ¡ 0 ¡ 0 ¡ 1 ¡ 2 ¡ 3 ¡ 4 ¡ 5 ¡ 6 ¡ 7 ¡ 8 ¡ 9 ¡ 10 ¡ 11 ¡ 12 ¡ 13 ¡ 14 ¡ 15 ¡ 16 ¡ 17 ¡ 18 ¡ 19 ¡ 20 ¡ 21 ¡ 22 ¡ 23 ¡ Hours ¡a;er ¡midnight ¡ ¡
Calculating cell-division rate 𝜈 = 1 /𝑜𝑢↓𝑒 ∑𝑗 =1 ↑𝑜▒𝑚𝑜 (1+ 𝑔↓𝑗 ) ¡ 𝜈 = ln ( 1+ 𝑔↓𝑛𝑏𝑦 ) ¡ • Both ¡of ¡these ¡equations ¡calculate ¡the ¡cell-‑division ¡rate ¡ • The ¡equations ¡take ¡the ¡number ¡of ¡dividing ¡cells ¡in ¡ proportion ¡to ¡the ¡number ¡of ¡total ¡cells. ¡ Campbell et al. 2010
Brachidinium capitatum cell concentration and tide velocity over time Velocity ¡out ¡of ¡estuary ¡(m ¡·√ ¡s ¡ -‑1 ) ¡ ¡Growth ¡rate ¡per ¡day ¡ ¡ ¡ Cells·√ ¡mL -‑1 ¡ Day ¡ Fig.4 Henrichs et al. 2011
• Research Question 2: Which stage of a Tripos furca bloom has the highest growth rate? • Hypotheses: We hypothesize that at the initial stages of the bloom we will see the highest growth rate. • Experimental Design: We will be using the cell division rate on classified files of Tripos furca over a bloom. This will be done using MATLAB program scripts written by Heidi Sosik. http://toast.tamu.edu/IFCB7/dashboard/http://toast.tamu.edu/IFCB7/D20130616T094005_IFCB007 ¡
Growth rate and cell abundance 1.00 ¡ 1.80 ¡ 0.90 ¡ 1.60 ¡ 0.80 ¡ 1.40 ¡ 0.70 ¡ 1.20 ¡ Growth rate (d -1 ) 0.60 ¡ 1.00 ¡ cells·ml -1 0.50 ¡ 0.80 ¡ ¡ 0.40 ¡ 0.60 ¡ 0.30 ¡ 0.40 ¡ 0.20 ¡ 0.20 ¡ 0.10 ¡ 0.00 ¡ 0.00 ¡ 1 ¡ 2 ¡ 3 ¡ 4 ¡ 5 ¡ 6 ¡ 7 ¡ 8 ¡ 9 ¡ 10 ¡ 11 ¡ 12 ¡ 13 ¡ 14 ¡ 15 ¡ 16 ¡ 17 ¡ 18 ¡ 19 ¡ Days Growth ¡rate ¡ Abundance ¡
Cell abundance is correlated with Tide 2.5 ¡ 13.5 ¡ 2 ¡ 11.5 ¡ 1.5 ¡ 9.5 ¡ Tidal Height cells·ml -1 7.5 ¡ 1 ¡ 5.5 ¡ 0.5 ¡ 3.5 ¡ 0 ¡ 1.5 ¡ -‑0.5 ¡ -‑0.5 ¡ June 14th through 19th Tide Velocity Cells per mL
The relationship of cell abundance and salinity 37 11 35 9 33 7 cell per mL salinity 31 5 29 3 27 1 25 -1 June 14th through 19th Salinity ¡ cells·√ml-‑1 ¡
Conclusion Phased division was found • The peak of division will be 8 hours • after midnight Growth rate was approximately • 0.7d -1 Expected trend in growth rate was • not seen possibly because of advection.
Acknowledgements I would like to thank the Campbell lab for all of their support and guidance throughout the summer. Dr. Campbell Dr. Henrichs McKensie Daugherty Darcie Ryan Lipan Apache Tribe of Texas REU participants
Recommend
More recommend