PERFWORKS A LIBRARY FOR GPU PERFORMANCE ANALYSIS Avinash Baliga, - PowerPoint PPT Presentation
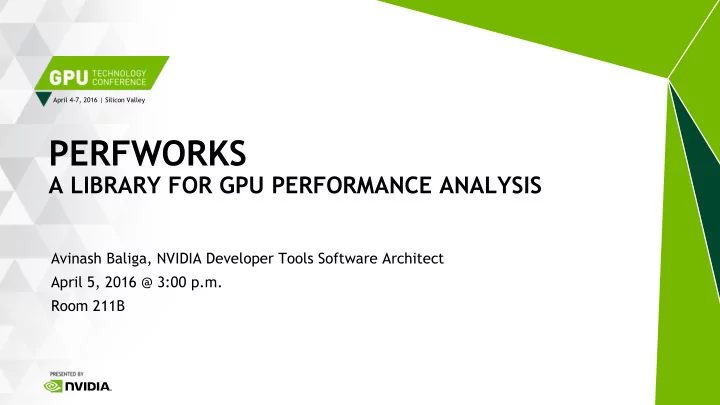
April 4-7, 2016 | Silicon Valley PERFWORKS A LIBRARY FOR GPU PERFORMANCE ANALYSIS Avinash Baliga, NVIDIA Developer Tools Software Architect April 5, 2016 @ 3:00 p.m. Room 211B NVIDIA PerfWorks SDK New API for collecting performance metrics
April 4-7, 2016 | Silicon Valley PERFWORKS A LIBRARY FOR GPU PERFORMANCE ANALYSIS Avinash Baliga, NVIDIA Developer Tools Software Architect April 5, 2016 @ 3:00 p.m. Room 211B
NVIDIA PerfWorks SDK New API for collecting performance metrics from NVIDIA GPUs. Cross-API: CUDA, OpenGL, OpenGL ES, D3D11, and D3D12 • Cross-Platform: Windows, Linux, Mobile • • GPUs: Kepler, Maxwell, Pascal Tegra, GeForce, Tesla, Quadro • Target Audience: tools developers, engine developers Successor to the NVIDIA Perfkit SDK (NVPMAPI) • Adds range-based profiling Supports next-gen APIs featuring multi-threaded GPU work submission • 2
GPU Counters and Metrics PerfWorks delivers actionable, high-level metrics, allowing you to recognize top performance limiters quickly and directly. Raw Counters : elapsed_cycles, time_duration • • Metric : average_clock_rate = elapsed_cycles / time_duration Metric Categories Cumulative Work : compute warps launched, shaded pixels • Timing : elapsed cycles, duration in nanoseconds • • Activity : active, stalled, idle cycles Throughput : rate of operations, memory transactions, instruction issue, etc. • 3
“Speed of Light” Metrics SOL = “Speed of Light” = peak throughput of a given piece of hardware max instructions per cycle, max bytes per cycle, etc. SOL% = achieved throughput, as % of the peak; “how close are you to perfection?” Unit SOL% takes the max across sub-unit SOL%s. SM, partition, sub-partition, ALU Example: the SM SOL% is the max of Instruction Issue utilization • ALU utilization • • Shared memory utilization Texture/L1 utilization • 4 Image of Maxwell SM sub-partition from NVIDIA GeForce GTX 750 Ti Whitepaper
Compute Metrics L1 Device Tex SM L2 Shared System % % % utilization utilization utilization Cache Hit/Miss Cache Hit/Miss Utilization Instruction Issue-Efficiency Utilization Utilization by Op Type Instruction Pipeline Statistics Efficiency Utilization by Client Stall Reasons 5
Compute Metrics: Compute-Bound L1 Device Tex SM L2 Shared System High instruction issue utilization Medium-low utilization on all other units High pipeline utilization 6
Compute Metrics: Memory-Bound L1 Device Tex SM L2 Shared System Medium-low utilization in the SM. One of the memory units has reached close to its maximum throughput. 7
Compute Metrics: Latency-Bound L1 Device Tex SM L2 Stalls System Shared High number of pipeline stalls. Medium-low utilization on everything . Same amount of data transferred from both L1 and L2. Or same amount from both L2 and memory. 8
Graphics Metrics Vertex Hull Domain Geom Tess Raster Shader Shader Shader Shader Pixel IA Shader (Vertex Fetch) SM (unified shaders) Front End CROP XFB (decoder) ZROP L1 Tex L2 CPU Image System Device 9
Range Based Profiling Previous tools profile one kernel or draw-call at a time: With PerfWorks, you can profile them as a range, allowing for inherent parallelism: Optimizing these 2 cases is very different! Improving individual duration may increase resource usage per kernel, which can • prevent parallelism or harm parallel execution time. Ranges can include diverse workloads, and setup cost. • 10
Multi-Pass Profiling The hardware has a limited number of physical counters. To collect more than the physical limit, PerfWorks requires the application to deterministically replay the GPU work multiple times. During each replay pass: the application must make the same GPU calls, with the same range delimiters • • a different set of counters is collected BeginPass Range A Range B EndPass BeginPass Range A Range B EndPass ctr1 ctr1 ctr0 ctr0 11 4/11/2016
CUDA Example { kernel1<<<1, N, 0, s0>>>(...); kernel2<<<1, N, 0, s1>>>(...); cuLaunchKernel(...); cudaDeviceSynchronize(); } 12
CUDA Example { NVPA_CUDA_PushRange('A'); kernel1<<<1, N, 0, s0>>>(...); Range ‘A’ kernel2<<<1, N, 0, s1>>>(...); NVPA_CUDA_PopRange(); NVPA_CUDA_PushRange('B'); Range ‘B’ cuLaunchKernel(...); NVPA_CUDA_PopRange(); cudaDeviceSynchronize(); } 13
CUDA Example do { cuCtxGetCurrent(&ctx); NVPA_Context_BeginPass(ctx); NVPA_CUDA_PushRange('A'); kernel1<<<1, N, 0, s0>>>(...); kernel2<<<1, N, 0, s1>>>(...); Replay NVPA_CUDA_PopRange(); Pass NVPA_CUDA_PushRange('B'); cuLaunchKernel(...); NVPA_CUDA_PopRange(); NVPA_Context_EndPass(ctx); cudaDeviceSynchronize(); } while ( ! IsDataReady(ctx) ); 14
CUDA Example do { cuCtxGetCurrent(&ctx); NVPA_Context_BeginPass(ctx); NVPA_CUDA_PushRange('A'); kernel1<<<1, N, 0, s0>>>(...); Range ‘A’ kernel2<<<1, N, 0, s1>>>(...); Replay NVPA_CUDA_PopRange(); Pass NVPA_CUDA_PushRange('B'); Range ‘B’ cuLaunchKernel(...); NVPA_CUDA_PopRange(); NVPA_Context_EndPass(ctx); cudaDeviceSynchronize(); } while ( ! IsDataReady(ctx) ); Range IDs gpu__dispatch_count A 2 B 1 15
OpenGL Example do { glContext = wglGetCurrentContext(); NVPA_Context_BeginPass(glContext); NVPA_OpenGL_PushRange('A'); glDrawElements(...); Range ‘A’ glDrawElements(...); Replay NVPA_OpenGL_PopRange(); Pass NVPA_OpenGL_PushRange('B'); Range ‘B’ glDrawElements(...); NVPA_OpenGL_PopRange(); NVPA_Context_EndPass(glContext); SwapBuffers(...); } while ( ! IsDataReady(ctx) ); Range IDs gpu__draw_count A 2 B 1 16
D3D12 Example Prebake draw calls into ID3D12GraphicsCommandList* pCmd = ...; a CommandList. NVPA_Object_PushRange(pCmd, 'A'); pCmd->DrawInstanced(...); Range ‘A’ pCmd->DrawInstanced(...); NVPA_Object_PopRange(pCmd); NVPA_Object_PushRange(pCmd, 'B'); pCmd->DrawInstanced(...); Range ‘B’ NVPA_Object_PopRange(pCmd); Submit rendering work. ID3D12CommandQueue* pQueue = ...; NVPA_Context_BeginPass(pQueue); NVPA_Object_PushRange(pQueue, 'F'); Replay Range ‘F’ pQueue->ExecuteCommandLists(1, &pCmd); Pass NVPA_Object_PopRange(pQueue); NVPA_Context_EndPass(pQueue); pSwapChain->Present(0, 0); 17
D3D12 Metric Data This example produces nested ranges . The CommandList ranges {A, B} are nested under the Queue range ‘F’. Range IDs gpu__draw_count gpu__time_duration F 3 800 usec F .A 2 700 usec F .B 1 500 usec Deterministic counters like draw count or shaded pixels will sum perfectly. Activity and throughput are NOT summable, due to parallel execution. 18
NVIDIA Nsight Range Profiler The new Range Profiler in the Nsight VSE Graphics Debugger allows you to define ranges by performance markers, render targets, shader programs, etc. This lets you see an overview of performance first, before drilling down into details. Every requested metric is re-collected per range. Image from NVIDIA Nsight VSE, showing perf markers from Unreal Engine 4 demo 19
Future: NVIDIA Developer Tools NVIDIA Developer Tools are moving to PerfWorks. Nsight Visual Studio Edition : new Graphics Range Profiler, Analysis CUDA Profiler • • CUDA Profiler Suite : CUDA Visual Profiler, nvprof Consistent metrics across tools and APIs. Bringing CUDA profiler features to OpenGL and D3D tools. 20
Future: NVIDIA Developer Tools 21
Future: PerfWorks SDK Source-level counters for compute and graphics shaders. GPU shader PC sampling, as in the Visual Profiler. Lower overhead, realtime counters – usable for perf stats in a HUD. Frequency-based sampling of GPU counters. GPU workload trace – events that produce an execution timeline. 22 4/11/2016
April 4-7, 2016 | Silicon Valley THANK YOU JOIN THE NVIDIA DEVELOPER PROGRAM AT developer.nvidia.com/join SEND QUESTIONS TO devtools-support@nvidia.com
BACKUP SLIDES... 24
D3D11 Sample ID3D11DeviceContext* pContext = ...; NVPA_Context_BeginPass(pContext); NVPA_Object_PushRange(pContext, 'A'); pContext->DrawElements(...); Range ‘A’ pContext->DrawElements(...); Replay NVPA_Object_PopRange(pContext); Pass NVPA_Object_PushRange(pContext, 'B'); Range ‘B’ pContext->DrawElements(...); NVPA_Object_PopRange(pContext); NVPA_Context_EndPass(pContext); pSwapChain->Present(0, 0); 25
Recommend
More recommend
Explore More Topics
Stay informed with curated content and fresh updates.


