Performance analysis Agenda Code Profiling Linux tools GNU - PowerPoint PPT Presentation
Blue Gene/Q User Workshop Performance analysis Agenda Code Profiling Linux tools GNU Profiler (Gprof) bfdprof Hardware Performance counter Monitors IBM Blue Gene/Q performances tools Internal mpitrace Library
Blue Gene/Q User Workshop Performance analysis
Agenda � Code Profiling – Linux tools – GNU Profiler (Gprof) – bfdprof � Hardware Performance counter Monitors � IBM Blue Gene/Q performances tools – Internal mpitrace Library – IBM HPC toolkit � Major Open-Source Tools – SCALASCA (fully ported and developed on BG/Q – Juelich Germany) – TAU � IBM System Blue Gene/Q Specifics – Personality 2
Using Xl compiler wrappers � Tracing functions in your code – Writing tracing functions – example in Xl Optimization and Programming guide • __func_trace_enter is the entry point tracing function. • __func_trace_exit is the exit point tracing function. • __func_trace_catch is the catch tracing function. – Specifying which functions to trace with the -qfunctrace option. 3
Standard code profiling
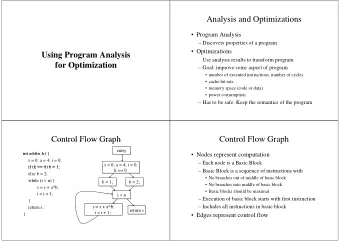
Code profiling � Purpose – Identify most-consuming routines of a binary • In order to determine where the optimization effort has to take place � Standard Features – Construct a display of the functions within an application – Help users identify functions that are the most CPU-intensive – Charge execution time to source lines � Methods & Tools – GNU Profiler, Visual profiler, addr2line linux command, … – new profilers mainly based on Binary File Descriptor library and opcodes library to assemble and disassemble machine instructions – Need to compiler with -g – Hardware counters � Notes – Profiling can be used to profile both serial and parallel applications – Based on sampling (support from both compiler and kernel) 5
GNU Profiler (Gprof) | How-to | Collection � Compile the program with options: -g –qfullpath + -pg (for gno profiler) – Will create symbols required for debugging / profiling � Execute the program – Standard way � Execution generates profiling files in execution directory – gmon.out.<MPI Rank> • Binary files, not readable – Necessary to control number of files to reduce overhead � Two options for output files interpretation – GNU Profiler (Command-line utility): gprof • gprof <Binary> gmon.out.<MPI Rank> > gprof.out.<MPI Rank> – Graphical utility / Part of HPC Toolkit GUI: Xprof � Advantages of profiler based on Binary File Descriptor versus gprof – Recompilation not necessary (linking only) – Performance overhead significantly lower 6
Using GNU profiling /bgsys/drivers/ppcfloor/gnu-linux/bin/ powerpc64-bgq-linux-gprof � BG_GMON_RANK_SUBSET=N /* Only generate the gmon.out file for rank N. */ � BG_GMON_RANK_SUBSET=N:M /* Generate gmon.out files for all ranks from N to M. */ � BG_GMON_RANK_SUBSET=N:M:S /* Generate gmon.out files for all ranks from N to M. Skip S; 0:16:8 generates gmon.out.0, gmon.out.8, gmon.out.16 */ � The base GNU toolchain does not provide support for profiling on threads � Profiling threads – BG_GMON_START_THREAD_TIMERS • Set this environment variable to “all” to enable the SIGPROF timer on all threads created with the pthread_create() function. • “nocomm” to enable the SIGPROF timer on all threads except the extra threads that are created to support MPI. – Add a call to the gmon_start_all_thread_timers() function to the program, from the main thread – Add a call to the gmon_thread_timer(int start) function from the thread to be profiled • 1 to start, 0 to stop 7
Hardware performance monitors
Hardware Counters � Definition – Extra logic inserted in the processor to count specific events – Updated at every cycle – Strengths • Non-intrusive • Very accurate • Low overhead – Weakness • Provides only hard counts • Specific for each processor • Access is not well documented • Lack of standard and documentation on what is counted => useful to use a higher level software � Purpose of a high level software (like IBM HPM) – Provides comprehensive reports of events that are critical to performance on IBM systems – Gathers critical hardware performance metrics • Number of misses on all cache levels • Number of floating point instructions executed • Number of instruction loads that cause TLB misses – Helps to identify and eliminate performance bottlenecks 9
BG/P versus BG/P Hardware Counters � BG/P – 256 64bit counters on Blue Gene/P • 72 of these counters are core specific while 184 counters are shared across the four PowerPC 450 cores • Max 4t � 288 independent core counts per process • shared counters measure events related to L2 cache, memory and network – Mode 0: cores 0 & 1 – Mode 1: cores 2 & 3 � BG/Q – Much more complex – Collects data from all cores, L1P Units, L2, Message Unit, IO Unit, CNK Unit (virtual) – 600 events (414 core specific) – 24 counters are available per core – Can handle hardware threads • Can provide per-thread counts of processor events • But the 24 counters must be shared between threads • 4 Hw Threads � 6 counters per thread • Max 64t � 384 independent core counts per process – Supports multiplexing – Provides ability to count more than the set (24) number of events – Basic Idea: Start with one set of events, after a time interval, set another event set 10
Multiplexing � Provides ability to count more than the set (24) number of events � Basic Idea: Start with one set of events, after a time interval, set another event set – Counter architecture identifies conflicts – Saves counts of conflicted events – Clears the counters and sets them to count new event – After another time interval switches back to original � Advantage : Can collect a lot more data in a single run � Disadvantage : Multiplexed counter accuracy is comprimsed – The counts are not correct unless the windows equally cover the code. – One set may only register events from one part of the algorithm – You cannot add/compare counts from events in the different groups � Use to get general overview of the counter values to see if they should be investigated in more detail 11
Nomenclature � UPC – Universal Performance Counting • Hardware and low-level software � BGPM – Blue-Gene Performance Monitor • Mid-Level software providing access to counters � HPM from IBM HPC toolkit – Hardware Performance Monitor • High-Level software providing access to counters (for devs) � Counter types � AXU, QPX, QFPU – All refer to the Quad FP Unit � XU, FXU – The Execution Unit (Fixed-Point Unit) – In PAPI FXU means floating-point unit! � IU – The instruction unit (Front-End of pipeline) 12
BG/Q Counter Related Software Layers High level software (IBM HPCT, IBM mpitrace, Scalasca 13
Performance Application Programming Interface (PAPI) � PAPI-C library - performance application programming interface (PAPI) – http://icl.cs.utk.edu/papi � The PAPI-C features that can be used for the Blue Gene/Q system include: – A standard instrumentation API that can be used by other tools. – A collection of standard preset events, including some events that are derived from a collection of events. The BGPM API native events can also be used through the PAPI-C interfaces. – Support for both a C and a Fortran instrumentation interface. – Support for separate components for each of the BGPM API unit types: • Punit counter is the default PAPI-C component. • L2, I/O, Network, and CNK units require separate component instances in the PAPI-C interface. – See PAPI and BGPM docs for which BGPM events map to PAPI events 14
BGPM (Blue-Gene Performance Monitor) | Details � BGPM API functions to program, control, and access counters and events from the four integrated hardware units and the CNK software counters. � Doxygen documentation gives detailed information on BGPM and counter architecture – /bgsys/drivers/ppcfloor/bgpm/docs/html/index.html � 4 main collection sources – Processor (Punit) • 24 Counters. Thread Aware. Multiple units e.g. Load-Store, Floating-Point, L1p .. – L2 • 6 counters per slice. Not thread/core aware • Usuallly operate in combined mode – IO Unit (MU, PCIE, DevBus) • Counts static set of events. Not thread/core aware – Network Unit • 6 counters per link (10 torus links, 1 I/O link) • Each link can only be counted by a single thread � 3 major modes of operation: – Software distributed mode • Each software thread configures and controls its own Punit counters – Hardware distributed mode • A single software thread can configure and simultaneously control all Punit counters for all cores – Low latency mode • Provides faster start and stop access to to the Punit counters 15
Recommend
More recommend
Explore More Topics
Stay informed with curated content and fresh updates.
