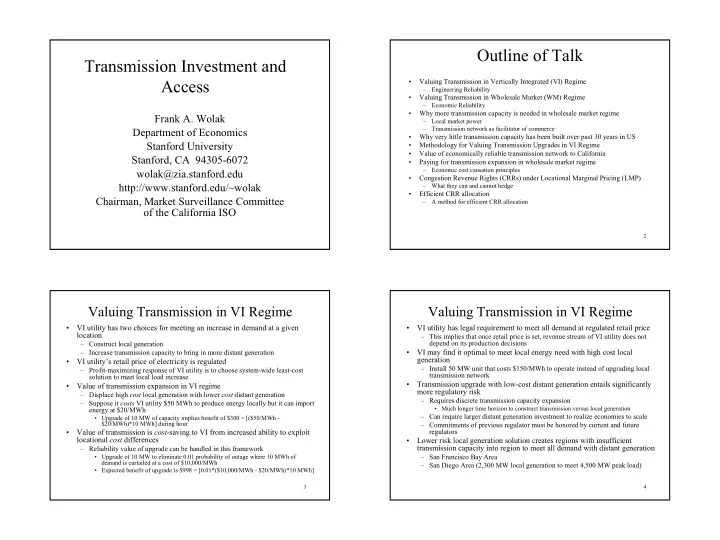

Outline of Talk Transmission Investment and Access • Valuing Transmission in Vertically Integrated (VI) Regime – Engineering Reliability • Valuing Transmission in Wholesale Market (WM) Regime – Economic Reliability • Why more transmission capacity is needed in wholesale market regime Frank A. Wolak – Local market power – Transmission network as facilitator of commerce Department of Economics • Why very little transmission capacity has been built over past 30 years in US Stanford University • Methodology for Valuing Transmission Upgrades in VI Regime • Value of economically reliable transmission network to California Stanford, CA 94305-6072 • Paying for transmission expansion in wholesale market regime – Economic cost causation principles wolak@zia.stanford.edu • Congestion Revenue Rights (CRRs) under Locational Marginal Pricing (LMP) http://www.stanford.edu/~wolak – What they can and cannot hedge • Efficient CRR allocation Chairman, Market Surveillance Committee – A method for efficient CRR allocation of the California ISO 2 Valuing Transmission in VI Regime Valuing Transmission in VI Regime • VI utility has two choices for meeting an increase in demand at a given • VI utility has legal requirement to meet all demand at regulated retail price location – This implies that once retail price is set, revenue stream of VI utility does not depend on its production decisions – Construct local generation • VI may find it optimal to meet local energy need with high cost local – Increase transmission capacity to bring in more distant generation generation • VI utility’s retail price of electricity is regulated – Install 50 MW unit that costs $150/MWh to operate instead of upgrading local – Profit-maximizing response of VI utility is to choose system-wide least-cost transmission network solution to meet local load increase • Transmission upgrade with low-cost distant generation entails significantly • Value of transmission expansion in VI regime more regulatory risk – Displace high cost local generation with lower cost distant generation – Requires discrete transmission capacity expansion – Suppose it costs VI utility $50 MWh to produce energy locally but it can import • Much longer time horizon to construct transmission versus local generation energy at $20/MWh – Can require larger distant generation investment to realize economies to scale • Upgrade of 10 MW of capacity implies benefit of $300 = [($50/MWh - $20/MWh)*10 MWh] during hour – Commitments of previous regulator must be honored by current and future • Value of transmission is cost -saving to VI from increased ability to exploit regulators locational cost differences • Lower risk local generation solution creates regions with insufficient transmission capacity into region to meet all demand with distant generation – Reliability value of upgrade can be handled in this framework – San Francisco Bay Area • Upgrade of 10 MW to eliminate 0.01 probability of outage where 10 MWh of demand is curtailed at a cost of $10,000/MWh – San Diego Area (2,300 MW local generation to meet 4,500 MW peak load) • Expected benefit of upgrade is $998 = [0.01*($10,000/MWh - $20/MWh)*10 MWh] 3 4 1
Engineering Reliability Differences in Supplier Incentives • Enough transmission capacity so that • Regime 1—VI utility (that owns local generation and – Demand at all locations in network can be met with pre- transmission network) had fixed price contract with retailer in specified probability DPL South – Assuming that vast majority of generation units in network – Strong incentive to limit locational price differences are owned and operated by same entity • Regime 2—Fixed price contract with retailer in DPL South • Because of structure of regulatory process in VI ended regime, strong incentive for VI to operate its – Strong incentive to increase locational price differences because this generation units to limit congestion increases value of VI utility’s local generation holdings and Congestion – Utility interested in minimizing total cost of supplying all Revenue Right (CRR) holdings of retail load • Regime 3—Large retailer divested large amount of DPL South – No incentive to operate high cost units more intensively to capacity to merchant generation owner increase locational price differences – Strong incentive to increase locational price differences between both • This only increases total costs of VI utility which reduces its profits DPL South (merchant supplier) and DPL North (large retailer) and • Recall VI utility’s revenue stream is independent of its actions other PJM locations 5 6 Incentives in Action in PJM Market Incentives in Action in PJM Market Average Real-Time Prices Real-Time Prices Average Regime 2: 07/23/99 - 06/24/01 Regime 1: 06/1/98 - 07/22/99 90.00 90.00 80.00 80.00 70.00 70.00 60.00 60.00 $/MWh 50.00 50.00 $/MWh 40.00 40.00 30.00 30.00 20.00 20.00 10.00 10.00 0.00 0.00 1 2 3 4 5 6 7 8 9 10 11 12 13 14 15 16 17 18 19 20 21 22 23 24 1 2 3 4 5 6 7 8 9 10 11 12 13 14 15 16 17 18 19 20 21 22 23 24 Hour Hour PJM West Hub DPL South DPL North PJM West Hub DPL South DPL North 7 8 2
Recommend
More recommend