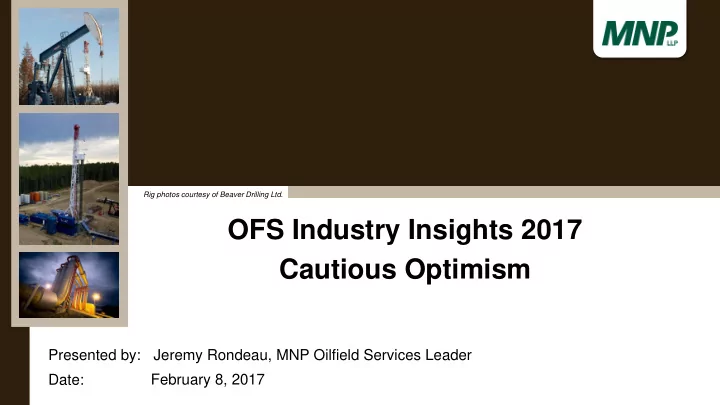

Rig photos courtesy of Beaver Drilling Ltd. OFS Industry Insights 2017 Cautious Optimism Presented by: Jeremy Rondeau, MNP Oilfield Services Leader Date: February 8, 2017
Agenda • Introduction • Saskatchewan • State of the Industry • Forecast • Uncertainty • USA and Donald Trump • Conclusion and wrap up Page 2
Introduction • Jeremy Rondeau, CPA, CA • Based out of Swift Current, Sask • National Oilfield Service Niche Lead effective June 1, 2016 • My background Page 3
Common Misconceptions about Saskatchewan • Saskatchewan is flat and boring Page 4
State of the Industry CAPEX – 4 Year Summary 2016 F Billions of Cdn$ 2013 2014 2015 Change $31 Total CAPEX $74 $81 $48 -35% Source: CAPP (http://www.capp.ca) Page 5
State of the industry CAODC Change from ‘14 2014 2015 2016 F Wells 11,226 5,394 3,562 -7,664 Utilization 46% 24% 17% -29% Operating Days 131,021 64,851 40,403 -90,618 Source: CAODC State of the Industry, 2016 Review & 2017 Forecast Page 6 http://www.caodc.ca/
STATE OF THE INDUSTRY PSAC Drilling 2013 2014 2015 2016 F Change Wells Drilled 11,074 11,204 5,378 3,315 -38% Meters Drilled (millions) 22.9 25.2 13.6 8.8 -35% Rig Operating Days 104,387 112,922 61,540 38,033 -38% Days Per Well 9.4 10.1 11.4 11.5 +1.0% Meters Per Well 2,068 2,248 2,536 2,650 +4.4% Source: PSAC (http://www.psac.ca/) Page 7
State of the industry wrap up • E&P (Exploration and production) Impact – Reduced margins as a result of lower prices – Reduced spending on exploration and production/service – 95 fewer E&P companies vs. 3 years ago (533 remain) – Of those 60% are challenged • OFS (Oilfield Service) – Provide service to E&P – Trickle down effect – Volume and pricing significantly impacted – Heavily dependent on E&P companies in geographic regions serviced Page 8
State of the industry wrap up • Jobs lost – Drilling and service (CAODC & PSAC) 33,568 – 100,000+ overall including E&P • 2014 – 2016 (have we hit the bottom?) • 2017??? Page 9
2017 Forecasts • CAPP forecasted approx. 20-25% increase in capital expenditures ($37 billion) • CAODC - Utilization increase to 23% vs 17% in 2016 (139 active rigs vs. 112 in ‘16) - Total number of wells 4,665 vs 3,562 • PSAC – Total wells 4,175 (225 more than forecast for 2016) • BOE report – Baker Hughes rig count – Jan 2017 301 vs. Jan 2016 192 Page 10
2017 Forecasts • Shift in drilling – Saskatchewan expected to out drill Alberta this year – Why? Quicker shallower wells – 1,940 in SK vs. 1,900 in AB • Pipeline Approval – Enbridge Line 3 – Trans Mountain – Keystone XL • Forecast summary – Moderate upswing Page 11
Uncertainty • Is the OPEC production freeze sustainable? • Pipelines In Limbo? – Northern Gateway – Energy East • Impact of Lobbyists – Celebrities (Jane Fonda, Leo DiCaprio) – Environmentalists • Where will capital come from? – Free Cash flow? Is there any? – Who will lend? Page 12
USA and Donald Trump • No to Carbon tax – US does not appear to be in favor of the carbon tax – Alberta implementation – does this drive investment south of the border? Or away from Canada • 16,000 km of pipeline built since Paris Agreement and lifted 40 year ban on oil exports • Trump wants the US to be energy independent • Customer? Competitor? Partner? • BAT (Border Adjustment Tax) on imports to the US? Page 13
Conclusion • The world needs oil – International Energy Agency (IEA) forecasts we’ll consume 40% more energy by 2040 • 2017 will be marginally better than 2016 • Our Newsletter – Reinstated newsletter – partnering with JWN – First issue released in January – Sign up to receive by email – http://www.mnp.ca/en/oilfield-services – Visit MNP.ca for more info Page 14
Conclusion • http://www.mnp.ca/en/oilfield-services Page 15
Contact information Jeremy Rondeau, CPA, CA Vice President, Oilfield Services DIRECT: 306.770.3679 EMAIL: jeremy.rondeau@mnp.ca Page 16
Recommend
More recommend