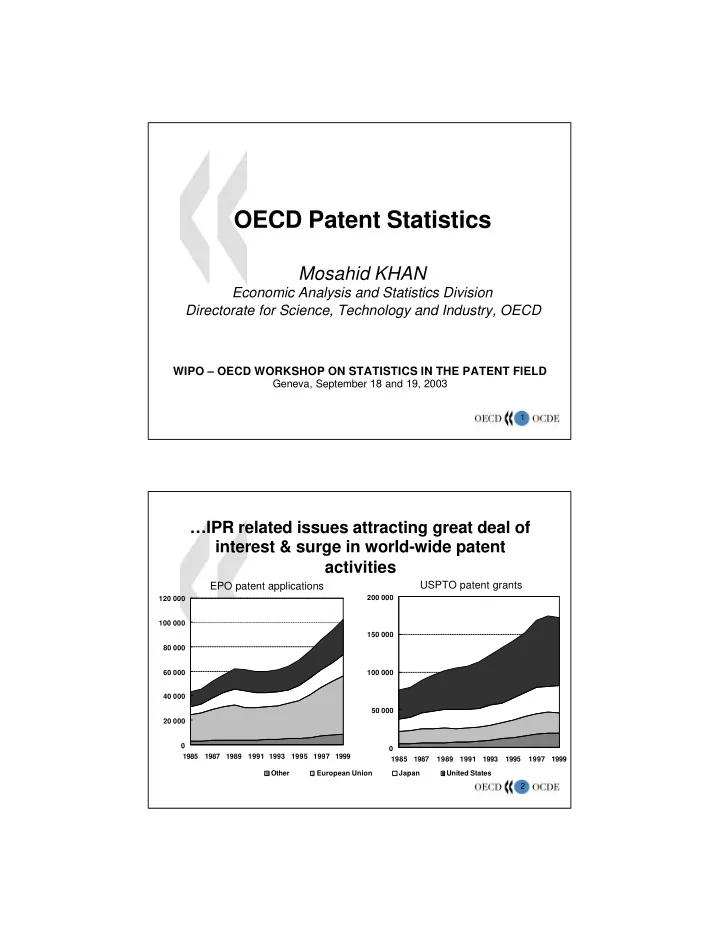

OECD Patent Statistics Mosahid KHAN Economic Analysis and Statistics Division Directorate for Science, Technology and Industry, OECD WIPO – OECD WORKSHOP ON STATISTICS IN THE PATENT FIELD Geneva, September 18 and 19, 2003 1 …IPR related issues attracting great deal of interest & surge in world-wide patent activities USPTO patent grants EPO patent applications 200 000 120 000 100 000 150 000 80 000 60 000 100 000 40 000 50 000 20 000 0 0 1985 1987 1989 1991 1993 1995 1997 1999 1985 1987 1989 1991 1993 1995 1997 1999 Other European Union Japan United States 2 1
Data availability and limitations Data sources � Primary Source – National and regional patent office – International organisation � Secondary Source – Commercial data provider – National and international public institutes Limitations � Difficult to access standardised data for statistical purpose � Limited metadata / methodological weakness 3 Patent statistics activities at the OECD � Complementary to existing efforts � International statistical infrastructure � Taskforce - EPO, JPO, USPTO, WIPO, EC, NSF & OECD � Database – EPO, USPTO, Patent families – National offices (e.g. JPO), citations, PCT (on going work) – Firm level data (on going) � Methodology – Counting procedure, families, technology, industry, citations, firm level data 4 2
Understanding patent indicators � Wide-ranging indicators: conflicting / misleading messages � Understanding patent indicators and what they reflect – Designing indicators to measure a particular phenomena � Methodological choice for calculating indicators – Geographical distribution – Reference date – Multiple inventors 5 Impact of methodological choice: reference date EPO patent applications USPTO patent grants 180000 120000 Grant Application Application 150000 90000 Priority 120000 Priority 90000 60000 Grant 60000 30000 30000 0 0 1980 1983 1986 1989 1992 1995 1998 2001 1980 1983 1986 1989 1992 1995 1998 2001 6 3
Impact of methodological choice: reference country Country shares in EPO applications, 1998 Applicant Inventor Priority Applicant Inventor Priority 8 8 50 50 40 40 6 6 30 30 4 4 20 20 2 2 10 10 0 0 0 0 European United Germany Japan France United Italy Netherlands Switzerland Israel Kingdom Union States 7 OECD patent indicators � Focus on inventive performance, diffusion, etc. � Priority date / inventor country � Priority date => time lag � International comparison (e.g. families) � …but indicators based on other criteria are available 8 4
Triadic patent families Patent applications to the EPO / Patent grants at the USPTO Triadic Patent Families OECD country shares, priority in 1999 % 100 15.9 32.4 European Union 80 46.5 United States 60 52.6 34.0 40 Japan 27.8 20 26.6 20.6 Other countries 17.4 10.9 8.3 7.0 0 EPO Triadic Patent USPTO Families 9 Technology areas Share of countries in Biotechnology patents - EPO, 1999 European Japan Germany Union 10.1% 11.0% 34.1% United Kingdom 7.4% France 5.1% Netherlands 2.4% Belgium 2.3% Denmark 1.6% Other European Other countries countries United 4.4% 10.4% States 45.3% Canada 2.9% Switzerland 1.6% Australia 1.3% Israel Other countries Korea 1.2% 2.5% 0.9% 10 5
Dissemination � Improve accessibility of data / metadata � Current OECD practice – Various OECD publications (e.g. Compendium) – CD-ROM for the TF members, test users, on request � Online access – www.oecd.org/sti/measuring-scitech – EPO / USPTO / Triadic patent families – Covers more than 100 countries – Reference date (application / priority / grant) – Reference country (inventor / applicant) – IPC / US patent class – International co-operation 11 Future plan � National patent office data � PCT database � Firm level data � Citations � Further methodological work � Improve dissemination of data 12 6
Recommend
More recommend