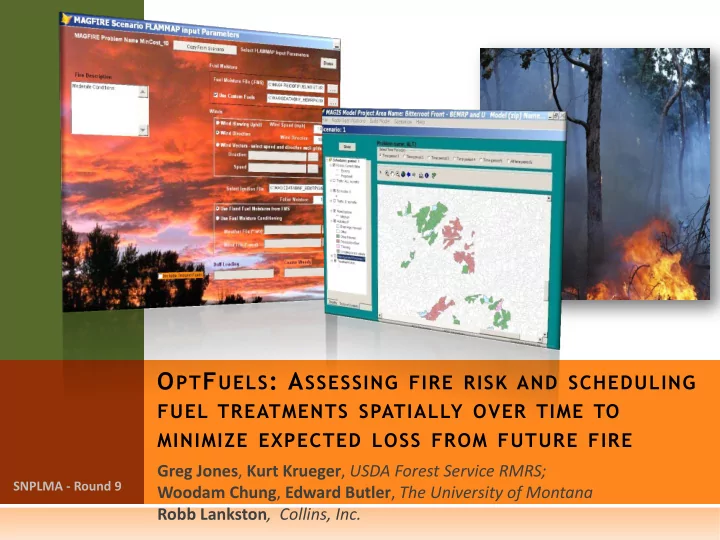

O PT F UELS : A SSESSING FIRE RISK AND SCHEDULING FUEL TREATMENTS SPATIALLY OVER TIME TO MINIMIZE EXPECTED LOSS FROM FUTURE FIRE Greg Jones , Kurt Krueger , USDA Forest Service RMRS; SNPLMA - Round 9 Woodam Chung , Edward Butler , The University of Montana Robb Lankston , Collins, Inc.
B ACKGROUND Different tools are available to help managers plan where, when, and how to apply new and maintenance fuel treatments on a forested landscape: FARSITE (Finney 1998) and FlamMap (Finney 2006) Treatment Optimization Model (Finney 2007) FVS-FFE (Reinhardt and Crookston 2003) FCCS (Ottmar et al. 2007) MAGIS (Zuuring et al. 1995, Chung et al. 2005) Etc. Each tool addresses only specific aspects of planning fuel treatments spatially over time.
O BJECTIVES FOR D EVELOPING O PT F UELS Integrate existing fire behavior (FlamMap), vegetation simulation (FVS-FFE), and land management planning (MAGIS) tools into one decision support system that supports long-term fuel management decisions in the Lake Tahoe Basin Optimize spatial and temporal location of fuel treatments to maximize landscape-level fuel treatment effects over time, Satisfy given budget and operational constraints, Meet water quality goals.
O PT F UELS S YSTEM C OMPONENTS
F OUR D EFAULT O PT F UELS M ODELS North Area East Area West Area South Area
O PT F UELS O BJECTIVE F UNCTION Objective for driving placement and scheduling of fuel treatments Minimize expected loss from wildland fire over time: Minimize ∑ ∑ P c,t × W r × Loss r,c,f,t t c where : t : Index of time period c : Index of grid cells (pixels) r : Index for risk category P c,t : Probability of cell c being burned in period t W r : Weight for risk category r Loss r,c,f,t : Expected loss for risk category r for grid cell c with flame length f in period t .
O BJECTIVE F UNCTION W EIGHTS AND L OSS Minimize ∑ ∑ P c,t × W r × Loss r,c,f,t t c Relative Loss Values 1 1 Based on Calkin et al 2010. Wilfire Risk and Hazard: Procedures for the First Approximation. RMRS-GTR-235.
O BJECTIVE F UNCTION B URN P ROBABILITY Minimize ∑ ∑ P c,t × W r × Loss r,c,f,t t c Burn Probability
S PECIFICATIONS FOR F UEL T REATMENT A LTERNATIVES Fire scenarios (1 or more) Ignition line or points Wind speed & direction Fuel Moisture Edit loss amounts for Risk Categories Constraints (by planning period) Limit treatment acres Limit Budget Pre-select Treatment Options
A PPLICATION Treatment Options Hand thinning followed by broadcast burn Mechanical thinning followed by mastication Time Periods Three time periods with 5-year interval Cluster Size 50-acre target Treatment Alternatives #1 No Action #2 ~ 30% of total treatable area (1,940 acres/pd) #3 ~ 50% of total treatable area (3,333 acres/pd)
A PPLICATION F IRE S CENARIO Ignition Line Wind Wind speed 22 MPH 222 Wind direction Fuel Moisture Fuel Category % Moisture 1 hr 4 10 hr 5 100 hr 7 Live herbaceous 50 Live woody 70 Foliar 90
A PPLICATION R ESULTS Risk Categories Treatment Level #1 (30%) Treatment Level #2 (50%) Period Period
Arrival Time Burn Probability N O A CTION (P ERIOD 1) Spread Minutes Probability 0 .1 .2 .3 .4 .5 .6 .7 .8 .9 Flame Length Expected Loss Meters Loss Index
Arrival Time Burn Probability T REAT 30% (P ERIOD 3) Spread Minutes Probability 0 .1 .2 .3 .4 .5 .6 .7 .8 .9 Flame Length Expected Loss Meters Loss Index
Arrival Time Burn Probability T REAT 50% (P ERIOD 3) Spread Minutes Probability 0 .1 .2 .3 .4 .5 .6 .7 .8 .9 Flame Length Expected Loss Meters Loss Index
A PPLICATION R ESULTS 3 nd Period
A PPLICATION R ESULTS Treat 30% Alternative
A PPLICATION R ESULTS Treat 30% Alternative
W HAT I S N EXT ? Develop a streamlined process for clipping and building planning-area specific OptFuels Models. Add functionality for entering treatment unit polygons with assigned treatments for analyzing alternatives at the project scale. Enhance the fuel treatment information provided by OptFuels: Biomass volumes & costs Costs for treatment options that do not remove biomass Future stand structure & other stand data with and without treatments Enhance the capability to estimate sediment delivery for various scenarios Deliver OptFuels to end users.
A CKNOWLEDGEMENTS Funding SNPLMA – Round 9 Rocky Mountain Research Station Project Team Woodam Chung, PI, The University of Montana Greg Jones, Co-PI, RMRS Solomon Dobrowski, Co-PI, The University of Montana William Elliot, Co-PI, RMRS Kurt Krueger, RMRS John Hogland, RMRS Robb Lankston, Collins, Inc. Edward Butler, The University of Montana David Schmidt, The University of Montana Jody Bramel, Axiom IT Solutions, Inc Collaborators Mark Finney, RMRS Elizabeth Reinhardt, USDA Forest Service Carl Seielstad, The University of Montana Janet Sullivan, formerly RMRS (OptFuels Website: http://www.fs.fed.us/rm/human-dimensions/optfuels)
T HANK Y OU ! Questions?
Recommend
More recommend