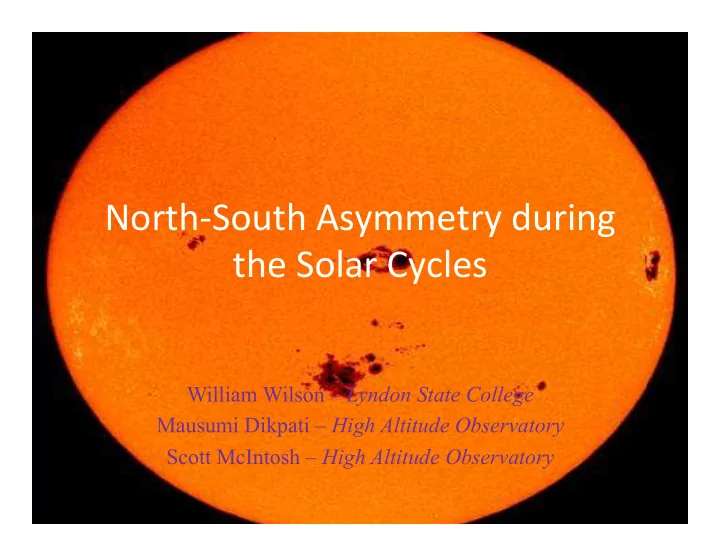

North-‑South ¡Asymmetry ¡during ¡ the ¡Solar ¡Cycles ¡ William Wilson – Lyndon State College Mausumi Dikpati – High Altitude Observatory Scott McIntosh – High Altitude Observatory
North and South Sunspot Area during 1875-2013 North ¡ 500 ¡ 0 ¡ Raw ¡Sunspot ¡area ¡data ¡from ¡the ¡NASA ¡Marshall ¡Space ¡Flight ¡Center ¡
The Sun’s natural tendency of coupling North & South hemispheres (1992 – 2013) 2002 1992 2000 2001 2003 2013 1999 1998 2004 2012 2005 1993 2006 2011 1994 2007 1995 1997 1996 2010
The Sun’s natural tendency of coupling North & South hemispheres movie ¡
More evidence for North-South Coupling To ¡the ¡Right ¡ Bo+om ¡ North-‑South ¡yearly ¡ North-‑South ¡yearly ¡ ¡ average ¡sunspot ¡area ¡ average ¡sunspot ¡area ¡ ¡ from ¡1992 ¡to ¡2013 ¡ from ¡1875 ¡to ¡2013 ¡in ¡ ¡ in ¡logarithmic ¡format ¡ linear ¡and ¡logarithmic ¡ ¡ format ¡
Comparing ¡Rise ¡Time, ¡Peak ¡Amplitude, ¡and ¡ Minimum ¡Amplitude ¡ Rise ¡;me ¡vs. ¡Minima ¡
Rise ¡Time ¡in ¡one ¡hemisphere ¡vs. ¡Minima ¡in ¡opposite ¡ hemisphere ¡(12 ¡month ¡smoothing) ¡ 0.116 ¡ 0.529 ¡ • Fast rise time in one hemisphere can cause a lower minima in the opposite hemisphere. • Intuitively, we can expect this because one hemisphere’s magnetic flux will annihilate the other hemisphere’s flux 0.406 ¡ Pearson ¡product-‑moment ¡correla8on ¡coefficient ¡
Rise ¡Time ¡in ¡one ¡hemisphere ¡vs. ¡Minima ¡in ¡the ¡Same ¡ Hemisphere ¡(12 ¡month ¡smoothing) ¡ -‑0.566 ¡ -‑0.193 ¡ • Fast rise time in one hemisphere does not lead to a lower minima, but rather leads to a higher minima in the same hemisphere • This is understandable because the magnetic flux in one hemisphere cannot annihilate it’s own flux -‑0.448 ¡
Rise ¡Time ¡vs. ¡Minima ¡(6 ¡month ¡smoothing) ¡ • For 6 month smoothing data, a fast rise time in one hemisphere causes a lower minima in the opposite hemisphere • However, rise time in one hemisphere also weakly 0.358 ¡ correlates with its own minima flux degrading the result 0.286 ¡
Rise ¡Time ¡vs. ¡Minima ¡(24 ¡month ¡smoothing) ¡ • For 24 month smoothing, the rise time in one hemisphere anti- correlates to the minima in the opposite hemisphere as well as in the same -‑0.378 ¡ hemisphere • The reason for this result was likely due to too much averaging of the data causing the sunspot data to lose some important features -‑0.189 ¡
Key ¡Results ¡for ¡Rise ¡Time ¡vs. ¡Minima ¡ ¡ • For ¡12 ¡month ¡as ¡well ¡as ¡6 ¡month ¡smoothing ¡of ¡ the ¡data, ¡a ¡fast ¡rise ¡Qme ¡in ¡one ¡hemisphere ¡ indicates ¡a ¡lower ¡minima ¡in ¡the ¡opposite ¡ hemisphere ¡ • However, ¡for ¡24 ¡month ¡smoothing ¡data, ¡a ¡rise ¡ Qme ¡in ¡one ¡hemisphere ¡anQ-‑correlates ¡with ¡ the ¡minima ¡in ¡the ¡opposite ¡hemisphere, ¡likely ¡ due ¡to ¡too ¡smoothing ¡of ¡the ¡raw ¡data ¡
Comparing ¡Rise ¡Time, ¡Peak ¡Amplitude, ¡and ¡ Minimum ¡Amplitude ¡ Peak ¡vs. ¡Minima ¡
Peak ¡vs. ¡Minima ¡in ¡the ¡Same ¡Hemisphere ¡ (12 ¡month ¡smoothing) ¡ ¡ 0.195 ¡ 0.522 ¡ • Stronger peak appears to lead to a higher minima level in the same hemisphere • This is what we should expect 0.289 ¡
Peak ¡vs. ¡Minima ¡for ¡Opposite ¡hemispheres ¡ (12 ¡month ¡smoothing) ¡ 0.334 ¡ 0.131 ¡ • Interestingly, peak correlates with a minima level in the opposite hemisphere, as well • This is counterintuitive, as the magnetic flux from one hemisphere annihilates the flux of the other hemisphere; We should expect an anti- 0.237 ¡ correlation
Key ¡results ¡for ¡Peak ¡vs. ¡Minima ¡ • A ¡posiQve ¡correlaQon ¡prevails ¡for ¡both ¡the ¡ same ¡and ¡opposite ¡hemispheres ¡for ¡6 ¡month ¡ and ¡24 ¡month ¡smoothing ¡data ¡ ¡ • Asymmetry ¡in ¡the ¡peaks ¡of ¡north ¡and ¡south ¡ hemispheres ¡does ¡not ¡lead ¡to ¡similar ¡ asymmetry ¡in ¡the ¡minima ¡level, ¡according ¡to ¡ the ¡data ¡
Conclusions • North and South hemispheres of the sun have a natural tendency to be decoupled, but there is a mechanism that tries to couple them continuously • 12 month smoothed data shows that there is a significant correlation between the rise time in one hemisphere and the minima level of the other hemisphere • 6 month smoothed data shows a similar correlation between the rise time in one hemisphere and the minima of the other hemisphere • However, 24 month smoothed data shows a weak anti-correlation between rise time in one hemisphere and minima level of the other hemisphere as well as with the same hemisphere; This is likely due to too much smoothing, which is causing a deterioration of the physics of the system • The data shows that a bigger peak should cause a larger minima in the same hemisphere, but the peak of one hemisphere does not have as much influence on the minima of the opposite hemisphere
The ¡End ¡ QuesQons? ¡Comments? ¡
Recommend
More recommend