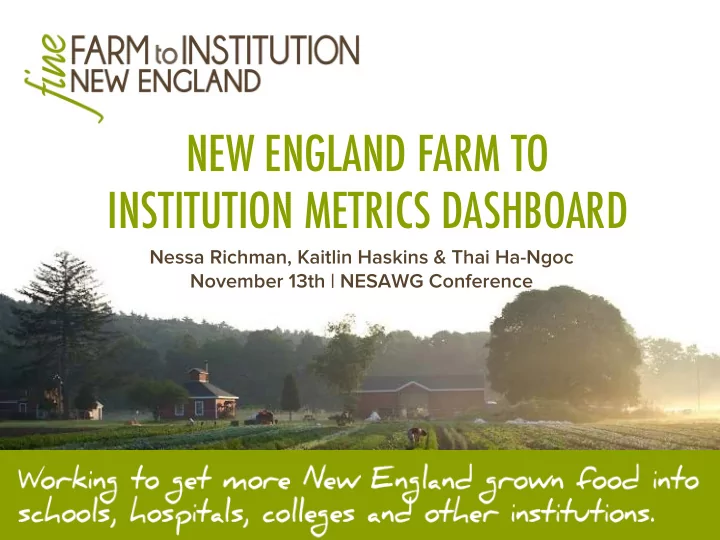

NEW ENGLAND FARM TO � INSTITUTION METRICS DASHBOARD � Nessa Richman, Kaitlin Haskins & Thai Ha-Ngoc November 13th | NESAWG Conference
ABOUT � I. THE PROJECT � II. THE TEAM � www.farmtoinstitution.org
THE PROJECT � Farm to Institution New England's Shared Metrics Project is a major data-driven overview of the farm to institution food market chain. Covers the supply chain from production to distribution and consumption. Focus is on three institutional sectors: schools, colleges and hospitals. www.farmtoinstitution.org
PROJECT TEAM � WORK TEAM � Coordinator: Nessa Richman, FINE Communications: Kaitlin Haskins, FINE Consultant: Lydia Oberholtzer, Community & Food Systems Resources Associate: Thai Ha-Ngoc, Henry P. Kendall Foundation Data Visualizations: Scott Sawyer, Vermont Farm to Plate Network ADVISORY TEAM Peter Allison, FINE Christine James, John Merck Fund Molly Anderson, College of the Atlantic Dawn King, Brown University Courtney Bourns, Henry P. Kendall Foundation Ji ff Martin, University of Connecticut Cris Co ffi n, American Farmland Trust Jennifer Obadia, Health Care David Conner, University of Vermont Without Harm Jill Fitzsimmons, University of New Hampshire Je ff Piestrak, Cornell University Gemma Gorham, Brown University www.farmtoinstitution.org
DATA � I. SECONDARY DATA � II. PRIMARY DATA � • Distributor Survey • Farm to College Survey • Producer Survey www.farmtoinstitution.org
SECONDARY DATA � • USDA list of food hubs • USDA Census of Agriculture • USDA Organic Producers survey • USDA ERS Food Atlas • USDA KYF2 Compass • Wallace Center Food Hub survey • Vermont Food Atlas www.farmtoinstitution.org
PRIMARY DATA � • Food distributors survey • College and university survey • Producer survey • Health care survey (with Health Care Without Harm) www.farmtoinstitution.org
DISTRIBUTOR SURVEY � Food Distribution in New England • Fielded: Summer 2015 • Implementation: Sent by email, with phone follow-up/ o ff er to manually complete while on phone • Major obstacles: phone follow-up time and e ff ort • 56 useable responses www.farmtoinstitution.org
FARM TO COLLEGE SURVEY � Colleges & Universities in New England • Fielded: Summer/Fall 2015 • Implementation: sent by email with a set of 2 email and 2 phone follow-ups • Major obstacles: timing was an issue, lots of dirty data • 105 useable responses Food service sta ff prepping breaded local fish for a seafood dinner. Photo by UNH www.farmtoinstitution.org
PRODUCER SURVEY � Food P r oduction in New England • Survey: reviewed by Advisory Team, wholesale readiness TA providers, other key individuals • Implementation: planned for January-February; working with state departments of ag, extension services, wholesale readiness TA providers Photo by Jon Katz www.farmtoinstitution.org
DASHBOARD � I. TOUR � II. OUTREACH � Photo by Health Care Without Harm www.farmtoinstitution.org
THE DASHBOARD! � DASHBOARD.FARMTOINSTITUTION.ORG � www.farmtoinstitution.org
OUTREACH � Our plan for getting the word out • Presentations at key state, regional and national events (e.g., federal and regional NASDA meetings) • Briefings for governmental agencies by request starting Winter/Spring 2016 • Every time we release a new report or make a major update, we’ll announce it through our newsletter list (join by visiting www.farmtoinstitution.org/newsletter) You can help! www.farmtoinstitution.org
CLOSING � I. NEXT STEPS � II. CONTACT INFO � Photo by UNH www.farmtoinstitution.org
NEXT STEPS � Up next for the s hared metrics project • Hard launch of dashboard! • Advisory Team will meet in early 2016 to make recommendations for year two • Potential areas of focus for year two: food processing, food waste, food access and justice • We’ll be thinking how to show change over time www.farmtoinstitution.org
CONTACT INFO � Keep in touch! NESSA RICHMAN Research & Development ¡ nessa@farmtoinstitution.org KAITLIN HASKINS Communications ¡ kaitlin@farmtoinstitution.org VISIT US ONLINE ¡ www.farmtoinstitution.org � Kaitlin Nessa www.farmtoinstitution.org
Recommend
More recommend