
Neutron Project Simulation Lee Tomlinson & Christine Nielsen
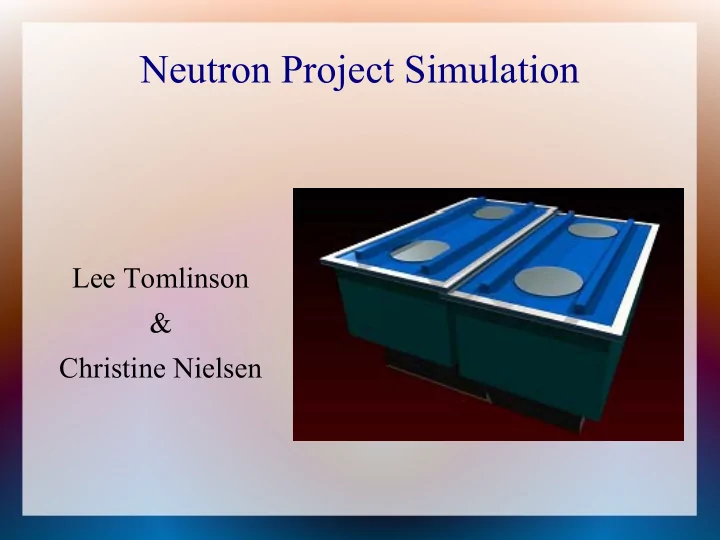
For a detailed description of the detector geometry used in our Geant4 simulation, please visit our wiki http://cdms.physics.ucsb.edu/neutron/wiki/
Initial approach Initially, we would like to answer several simple questions; namely: What is the Čerenkov threshold of an electron, in water, given a certain initial energy? How far does an electron typically travel, in water, before it falls under this threshold? At threshold, in what direction do the electrons travel, relative to the direction they were fired?
Čerenkov threshold in water This histogram shows the distribution of Čerenkov threshold energies in Geant4, for electrons in water. The different colors represent different initial energies of the electrons. 20,000 iterations were used in this simulation.
Čerenkov distance in water This histogram shows the distribution of how far electrons, with different initial energies, travel in Geant4 before they fall under the Čerenkov threshold for water. 20,000 iterations were used in this simulation.
Čerenkov distance in water Same question that previous slide attempts to answer, except this time we're dealing with the “along-the-track” distance, not the “line- of-sight” distance. 20,000 iterations were used in this simulation.
Angular distribution of final momentum direction of electrons in water This histogram shows how the final momentum direction (defined as the direction in which the electron travels at its Čerenkov threshold in water) varies with initial energy in Geant4. This is important in determining the isotropy of Čerenkov radiation in the experiment. 20,000 iterations were used in this simulation.
What are those spikes in the distance histograms? We were troubled by the spikes in the two distributions that represent the distance the electron travels before it falls below the Cerenkov threshold. It appeared, to us, as though it may have been an artifact of the Monte-Carlo simulation; so we took measures to decrease the step-size. Initially, the step-size was set to 100 optical photon emissions by Cerenkov radiation per step, so we set this to the smallest possible value: 1. In the next few slides, we have repeatedly answered the same questions as before, but using a far higher resolution simulation...
Cerenkov threshold As before, but with 100 times as many steps. This was done in an effort to minimize the amount by which the simulation “misses” the actual threshold, because of an overly large step-size.
Distance the electron travels as it Cerenkov radiates
Angular distribution of final momentum direction of electrons Notice the difference in the distribution towards the higher angles; it is convex now, as opposed to concave... High-res simulation Low-res simulation
Alternative Tracking Method In addition to decreasing the step size, the simulation was also re-run using a different tracking method for finding the Cerenkov threshold.
Distance traveled by e- using second tracking method
Recommend
More recommend