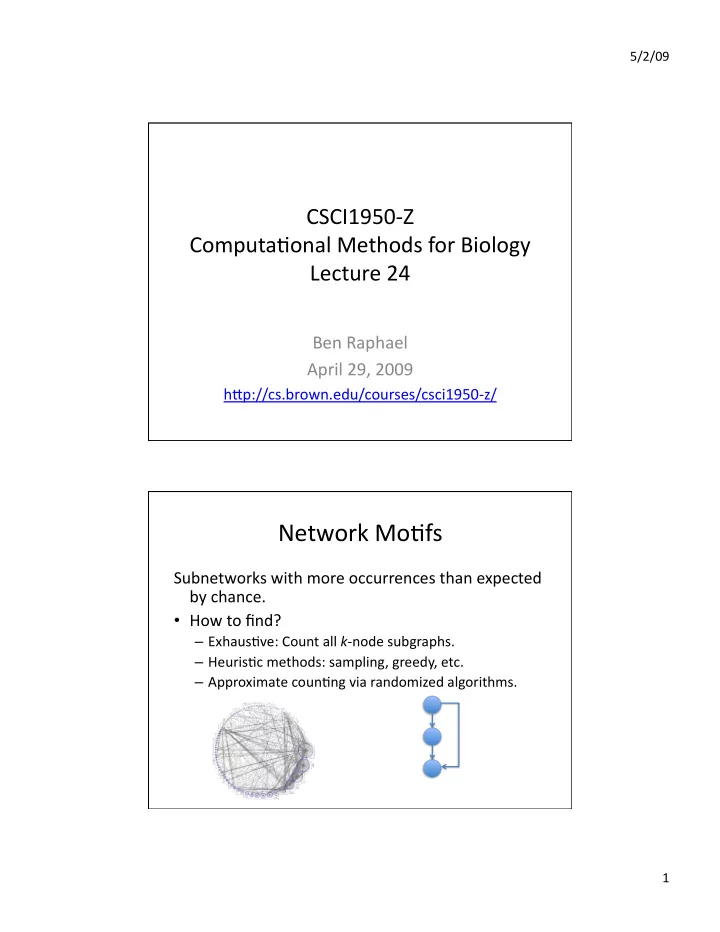

5/2/09 CSCI1950‐Z Computa3onal Methods for Biology Lecture 24 Ben Raphael April 29, 2009 hGp://cs.brown.edu/courses/csci1950‐z/ Network Mo3fs Subnetworks with more occurrences than expected by chance. • How to find? – Exhaus3ve: Count all k ‐node subgraphs. – Heuris3c methods: sampling, greedy, etc. – Approximate coun3ng via randomized algorithms. 1
5/2/09 Network Mo3fs Subnetworks with more occurrences than expected by chance. • How to assess sta3s3cal significance? – Compare number of occurrences to random network. Random Networks Occurrence of mo3fs depend strongly on network topology. What is an appropriate ensemble of random networks? (null model) 2
5/2/09 Random Networks One parameter governing occurrence of mo3fs is degree distribu3on. hGps://nwb.slis.indiana.edu/community/?n=CustomFillings.AnalysisOfBiologicalNetworks Preserving Degree Distribu3on How to sample a graph with the same degree sequence? Method of Newman, Strogatz and Watts (2001) 1. Assign indegree i ( v ) and outdegree o ( v ) to vertex v according to degree sequence. 2. Randomly pair o ( v ) and i ( w ). 3
5/2/09 Network Mo3fs • Transcrip3onal regulatory network of E. coli: • 116 transcrip3on factors • ~700 “genes” (operons) • 577 interac3ons. Shen‐Orr et al. 2002 E. coli Network Mo3fs • Enumerated all 3 and 4 node mo3fs. • Looked for iden3cal rows in adjacency matrix (SIM) • Used clustering algorithm to iden3fy DOR. Shen‐Orr et al. 2002 4
5/2/09 Coun3ng Subnetworks G = (V,E). |V| = n. |E| = m. • Network‐centric approach – Count/enumerate all subgraphs with ≤ k ver3ces. – Imprac3cal for large n , m , k • Query‐based approach – Enumerate query graphs Q. – For each Q, count occurrences. (Subgraph isomorphism) – Q could be a non‐induced subgraph. Coun3ng non‐induced subgraphs Suppose want to count paths in G = (V,E). Idea: use color‐coding to count colorful paths – Dynamic programming solu3on (Whiteboard) Can extend dynamic program to count trees and bounded treewidth graphs. 5
5/2/09 Rela3on between Forward and Viterbi VITERBI FORWARD Ini0aliza0on: Ini0aliza0on: f 0 (0) = 1 V 0 (0) = 1 f k (0) = 0, for all k > 0 V k (0) = 0, for all k > 0 Itera0on: Itera0on: = e j (x i ) max k V k (i‐1) a kj f l (i) = e l (x i ) Σ k f k (i‐1) a kl V j (i) Termina0on: Termina0on: P(x, π *) = max k V k (N) P(x) = Σ k f k (N) a k0 Importance of Network Mo3fs • Building block of networks. • Indicate modular structure of biological networks. • Appearance of some mo3fs might be explained by par3cular dynamics (e.g. feedforward and feedback loops) Healthy skep3cism about all these claims, par3cularly because data is incomplete. 6
5/2/09 Network Integra3on Given : G = (V,E) interac3on network. V = genes E = protein‐DNA or protein‐ protein interac3ons Normalized expression “z‐score” z ij for gene i in condi3on/sample j. Goal : Find “ac3ve subnetworks”. Subgraphs whose genes are are differen3ally expressed in many condi3ons. (Whiteboard) Ideker, et al. (2002); Chuang et al. (2007) Network Integra3on Given : G = (V,E) interac3on network. V = genes E = protein‐DNA or protein‐ protein interac3ons M = [ z ij ] z‐scores of gene i in condi3on/sample j. Goal : Find A* = argmax r A A: connected subgraph Ideker, et al. (2002); Chuang et al. (2007) 7
5/2/09 Finding High‐scoring subnetwork Simulated Annealing: Iden3fy set of ac3ve nodes. Global op3miza3on method. G w = working subgraph induced by ac3ve nodes. Based on idea of random, local search – similar to MCMC. “Temperature” func3on controls when moves to subop3mal neighbors are permitng. Temperature decreased during search, so that eventually seGle in local op3mum. Results 8
5/2/09 Future: Knockout Experiments & Reverse Engineering Input : Signal Output : Gene/protein expression. Given input‐output rela3onship for normal (“wild type”) and mutant (“knockout”) cells, what can one infer about the network? • Topology: hard or impossible de novo : too many combina3ons. • New interac3ons or signs of exis3ng interac3ons. Future: Engineering Networks Engineer biological networks to perform new tasks. Change metabolic networks to create cells that produce new products. 9
5/2/09 Sources Shen‐Orr, S.S., Milo, R., Mangan, S., et al. 2002. Network mo3fs in the • transcrip3onal regula3on network of Escherichia coli . Nature Gene;cs 31, 64–68. • Newman, M.E.J., Strogatz, S.H., and WaGs, D.J. 2001. Random graphs with arbitrary degree distribu3ons and their applica3ons. Phys. Rev. E 64, 026118– 026134. Ideker T, Ozier O, Schwikowski B, Siegel AF. Discovering regulatory and signalling • circuits in molecular interac3on networks. Bioinforma;cs . 2002;18 Suppl 1:S233‐40. • Chuang HY, Lee E, Liu YT, Lee D, Ideker T. 2007. Network‐based classifica3on of breast cancer metastasis. Mol Syst Biol . 2007;3:140. 10
Recommend
More recommend