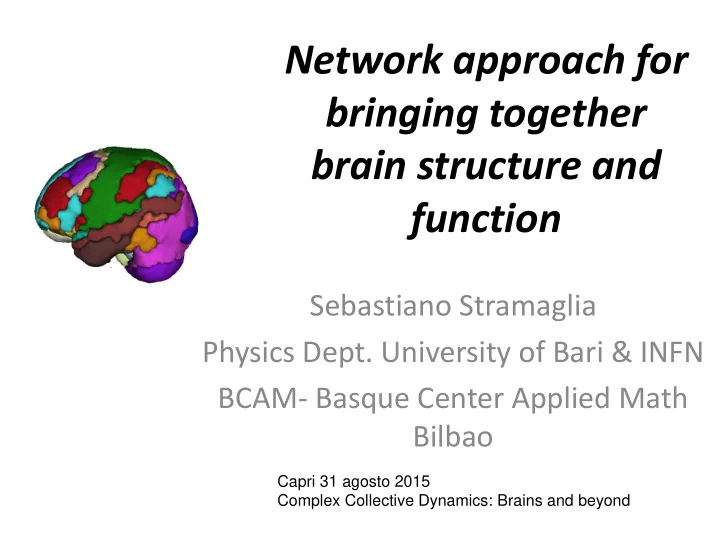

Network approach for bringing together brain structure and function Sebastiano Stramaglia Physics Dept. University of Bari & INFN BCAM- Basque Center Applied Math Bilbao Capri 31 agosto 2015 Complex Collective Dynamics: Brains and beyond
http://lanl.arxiv.org/abs/1410.7959 Sci. Rep. 2015 Work done with: Paolo Bonifazi (Tel Aviv) Ibai Diez (Bilbao) Iñaki Escudero(Bilbao) Beatriz Mateos (Bilbao) Miguel A. Muñoz (Granada) Jesus M Cortes (Bilbao)
Brain networks ~cm STRUCTURE space Neuronal circuits ~mm Neuron ~ m m
Brain networks ~cm STRUCTURE space Neuronal circuits ~mm Brain rhythms Neuron ~ m m DYNAMICS time
The operational brain : the structural-functional cycle STRUCTURE Dynamics reinforces structure Topology supports dynamics BRAIN OPERATIONAL PLASTICITY OPERATIONAL TOPOLOGY FUNCTIONS Circuitries’ dynamics Circuitries’ structure FUNCTION
Science 2013
The conjecture of the brain at criticality Chialvo D.R. and Bak P. (1999) Bak P and Chialvo D.R. (2001) Eguíluz V.M., Chialvo D.R., Cecchi G., Baliki M, and Apkarian AV. (2004) Chialvo, D. R. (2004) D. Fraiman, P. Balenzuela, J. Foss and D. R. Chialvo (2004) D. R. Chialvo (2010)
Macroscale structural networks: Connectome from Diffusion Tensor Imaging • It measures the magnitude and orientation of water molecules diffusion within brain tissues
Functional Connectivity • Statistical dependency between neuronal units (also distant ones) • Correlation between BOLD time series
Dynamical systems on the connectome: Chialvo, Sporns, Deco, Jirsa, Marinazzo , SS …
Link-wise comparison Ising model
Pairwise link-to-link comparison From Honey,…Sporns, PNAS 2009
Multilayer networks S Boccaletti , et al. Physics Reports 544 (1), 1-122, 2014
Decomposing the brain in modules • Important to reduce the variability of anatomical and functional patterns in the class of healthy subjects • Paradigm signal vs noise -> patient vs healthy • Parcellations based on anatomy or function, separately, are well known (AAL, RBN, …) • The question we pose here: is there a decomposition accounting for both structure and function? • Ans: YES • What is the most suitable resolution of the modular decomposition to describe the common structure-function modular skeleton? • Ans: Cross-modularity
Automated Anatomical Labeling parcellation of the brain: 90 anatomical areas N. Tzourio-Mazoyer, B. Landeau,D. Papathanassiou, F. Crivello, O. Etard, N. Delcroix, Bernard Mazoyer and M. Joliot, NeuroImage 2002
RESTING BRAIN NETWORKS • Distributed sets of brain regions whose spontaneous activity exhibits a large degree of temporal coherence (Biswal et al., 1995) • Identified by Independent Component Analysis (ICA) • a high degree of reproducibility of RSNs both across healthy subjects and across datasets acquired on the same subject. • RSNs correspond to regions that are known to share and support cognitive functions • Alterations in resting state networks have been reported in several brain pathologies and diseases
Medial Lateral Visual Visual Sensory Auditory Motor Default Executive Mode control Network Dorsal Dorsal Visual Visual Stream Stream Right Left COGNITIVE CORRELATES OF THE RSNs
Traumatic Brain Injury patients Minimally Vegetative Conscious State State Locked-In Syndrome no aware partial aware (arousal) aware aware no awake no awake no awake awake (can ’ t move) (Noirhomme et al 2010)
Relation between structural and functional networks
Our data set Structural Connectivity and Functional Connectivity (resting conditions) from the same subject (Bilbao Cruces Hospital) 12 Healthy human subjects, age 33.5 ± 8.7 Resolution: 2514 ROIs
Our approach: comparison at the moduli level Contrast functional and structural networks by exploiting thier hierarchical modular organization (Skudalski et al 2008, Betzel et al 2013, Kolchinsky et al 2014)
Cosine distance between ROIs • For each ROI, the feature vector is the connectivity to all the 2514 ROIs. • For each pair of ROIs, the cosine distance is defined as one minus the cosine between the two feature vectors
Agglomerative Hierarchical Clustering Need to define the distance between the Distance between joined clusters new cluster and the other clusters. Single Linkage: distance between closest pair. 2 4 Complete Linkage: distance between farthest pair. Average Linkage: average distance between all pairs 5 or distance between cluster centers 3 1 The dendrogram induces a linear ordering of the data points 1 3 2 4 5 Dendrogram
Comparison at the moduli level Clustering of rsFC -> ordering for both rsFC and SC
Hierarchical Clustering provides a tree of modules How to choose the optimal resolution of clustering?
Similarity Sorensen index L Modularity Q
Cross Modularity X A, B two networks with the same nodes Π a partition of nodes 3 1 [ ] X Q L Q A AB B
Optimal partition 20 modules
All the modules are characterized anatomically (and have cognitive correlates)
Some modules are compact
Some are made of anatomically distinct components
The wiring among these components is evident after plotting fibers
Overlap with AAL and RBN modules
Robustness
TEMPLATE ASSESSMENT SUBJECT DTI structure Brain insults structural – functional Brain recovery brain networks Pathology function fMRI Development Aging
Usefulness of cross-modularity: Real data • 14 healthy subjects in wakefulness and propofol anesthesia • 116 ROIs resolution
CM empirical-model functional correlations
CM structural-empirical fc
Conclusions Our results show that when trying to correlate brain structure with function, a clear structure-function matching emerges when applying a hierarchical modular approach. This new large-scale brain division will have an impact to study brain disorders , as anomalies in this partition might reflect pathologies with both a functional and anatomical character.
www.nitr.org/projects/biocruc_hcatlas To download the hierarchical partition, the brain networks and the code for cross-modularity
Recommend
More recommend