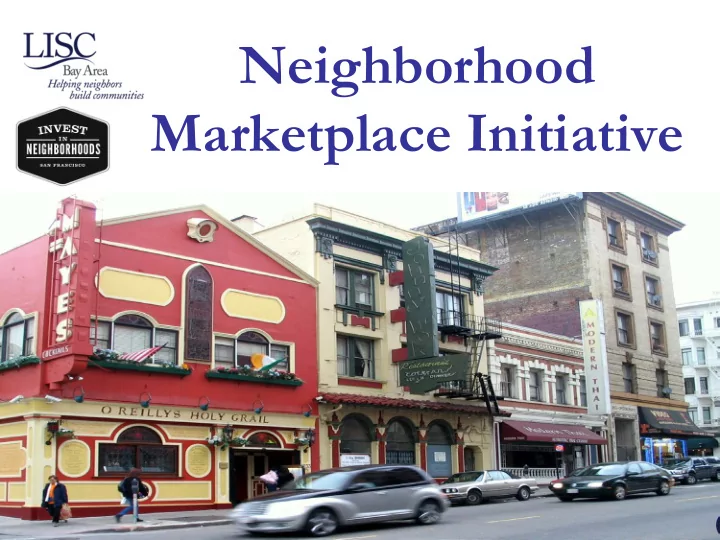

Neighborhood Marketplace Initiative
Why Neighborhood Commercial Districts? • Vibrant commercial districts can transform community’s identity • Cultural heart of a community • Central place to bring neighborhood stakeholders together • Catalysts for community-based stewardship of entire neighborhood • Identified need for better mix of retail and service oriented businesses
Bay Area Commercial District Struggles • Lack of neighborhood-serving retail • Perception of significant safety and crime • High commercial vacancy rates • High real estate cost • Threat / fear of displacement • Absentee property owners • Deficient in strong merchant leadership • History of City inaction • Lack of coordination among community stakeholders and other agencies • Unsuccessful past efforts
Evolution of NMI 1996 Fruitvale Main Street chosen as pilot site 2002 – Main Street program launches in Richmond LISC asked by SF Supervisor to conduct planning in the Excelsior District – 2003 – The City of SF contracts with LISC to conduct commercial revitalization in the most needy SF neighborhoods – LISC issued RFP to conduct community planning and create corridor programs in 5 SF neighborhoods 2005 LISC and City of SF formalized the NMI partnership 2012 Mayor Ed Lee Announces the Invest in Neighborhoods Initiative (IIN), which focuses on 25 neighborhood commercial corridors and aims to support the revitalization efforts of commercial corridor stakeholders throughout the city LISC and the City of SF have jointly funded NMI Corridors for 11 years
NMI/IIN Goals • Create vibrant and viable neighborhood commercial districts with flourishing small businesses and a community- friendly atmosphere • Meet the needs of local people by providing neighborhood-serving goods and services • Expand avenues for cultural development and expression • Improve the physical appearance of the neighborhood while preserving the local history and culture • Address quality of life issues • Build community-based collaborations to address problems and serve as long-term stewards
• One on One TA • Loans • TI Grants • Neighborhood Marketing • Crime Prevention • Business Guides High Existing • Graffiti & Trash Removal • Branding -Banners -Shop Local Quality of Businesses • Sidewalk Cleaning • Events Life Thrive • Activated public space • Festivals • Art Walks • Targeted Business Attraction • New Development • Community Group to Healthy Advocate/Implement • Neighborhood Commercial Association Strong • CBD District Community • CBO Capacity • Steering Committee • Façade Grants • Merchant Association • Window Signs • Murals/Beautification • Sustainable Funding Stream • Public art installations (e.g., CBD) Attractive • Neighborhood Physical landmarks Conditions • Streetscape Improvements • Outdoor furniture • Design Guidelines • Appropriate Zoning
Baseline Services OEWD Staff Storefront Support SF Jobs Squad Community Invest in Capacity Neighborhoods Building Mini-Grants Loan Programs Products
Commercial District Assessment Physical Conditions Assessment Past/Current Plans and Projects Social Capital Assessment Stakeholder Interviews & Surveys Best Practices Economic Data Demographic Data 25 Neighborhood Profiles
Customized Services OEWD: Targeted OEWD: SF Shines Business MOHCD: Façade & Tenant Attraction CDBG Funding Improvements DPW: Corridors GSA: Program Community Challenge Grant DPW/MTA: SFPD: GFTA/SFAC: Streetscape SF Planning: Merchant Arts Improvements Site Analysis Walks Activation
Key Features of Our Strategy Community Driven • Community’s vision for future informs the work Collaborative • Realizing a joint vision Culturally • Diversity & culture as asset Oriented • Supporting low-income residents & existing immigrant businesses Market Driven • Vision balanced by market realities • Helping existing businesses function in market • Values on-the-ground knowledge Capital Investment • Signals with small physical improvements • Community input into new development, according to vision Sustained • Long term efforts – 3 yrs + • Programs act as stewards of community assets • Goal for local, sustainable funding (i.e.) Business Improvement Districts
Outcomes Framework Increased economic viability of business district. • Existing neighborhood-serving businesses grow and stay in the district and the businesses mix meets the needs of the community and creates jobs particularly for residents. Greater public and private investment improves the • physical and business environment (properties and streetscape). Events and activities contribute to an enhanced quality of • life for neighborhood residents and merchants by improving safety and cleanliness, and strengthening the sense of community. Improvements benefit existing residents and merchants • by providing them access to affordable goods and services, employment, and cultural gathering places. Increased civic participation in the neighborhood. •
What We Do PROGRAM SUPPORT & DEVELOPMENT COMMUNITY PLANNING • Community planning • Program development • Annual Action Plans • Best practices and research projects • Project-based planning processes • Provide consultants to community programs ECONOMIC ANALYSIS • Conflict resolution in communities • Market and demographic research • Retail development strategies ORGANIZATIONAL DEVELOPMENT • Organizational structure GRANTMAKING & FUNDRAISING • Board development/training • Raise and advocate for funding for groups • Hiring process • Community Benefit District formation • Management & professional development TRAINING & PEER NETWORKS • Ongoing training for staff and board EVALUATION & LONG-TERM PLANNING • Trainings by topic • Program monitoring and evaluation • Intensive one-on one coaching • Policy development • Bay Area-wide and national focus CITY COORDINATION • Ensure corridors are prioritized ENSURE ACCOUNTABILITY • Advocacy • Provide community representation • Track progress via outcomes/work plans • Maintain collaborative process
2005-2013 NMI Cumulative Outcomes 1,067 businesses attracted/expanded 875 new jobs created 794 business assisted Average vacancy rate is 4% 1,150 neighborhood events 1,455,184 visitors attracted 15,497 volunteers who have contributed 80,236 hours $6,126,640 public dollars leveraged for physical improvements $4,831,987 private dollars leveraged for physical improvements
Recommend
More recommend