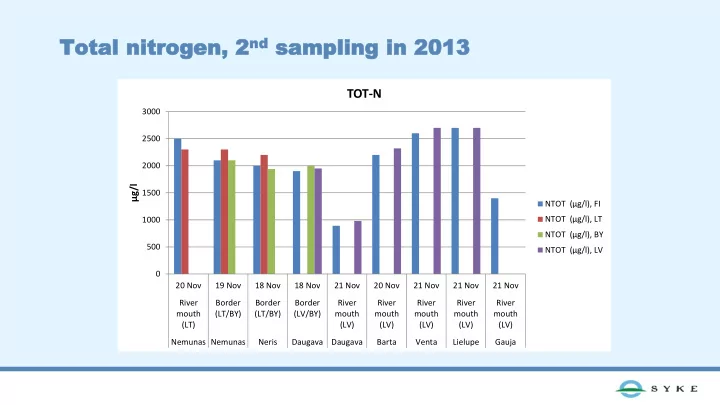

nd sa Tota Total l nitr nitrog ogen en, , 2 nd sampling mpling in in 20 2013 13 TOT-N 3000 2500 2000 µg/l 1500 NTOT (µg/l), FI NTOT (µg/l), LT 1000 NTOT (µg/l), BY 500 NTOT (µg/l), LV 0 20 Nov 19 Nov 18 Nov 18 Nov 21 Nov 20 Nov 21 Nov 21 Nov 21 Nov River Border Border Border River River River River River mouth (LT/BY) (LT/BY) (LV/BY) mouth mouth mouth mouth mouth (LT) (LV) (LV) (LV) (LV) (LV) Nemunas Nemunas Neris Daugava Daugava Barta Venta Lielupe Gauja
st sa Tota Total l phosphorus phosphorus, , 1 st sampling mpling in 201 in 2013 PTOT 140 120 100 80 PTOT (µg/l), FI µg/l PTOT (µg/l), LT 60 PTOT (µg/l), BY1 40 PTOT (µg/l), BY2 PTOT (µg/l), BY3 20 PTOT (µg/l), LV 0 27 May 28 May 28 May 29 May 29 May 30 May 30 May 30 May River mouth Border Border Border River mouth River mouth River mouth River mouth (LT) (LT/BY) (LT/BY) (LV/BY) (LV) (LV) (LV) (LV) Nemunas Nemunas Neris Daugava Daugava Lielupe Venta Gauja
nd sa Tota Total l phosphorus phosphorus, , 2 nd sampling mpling in 201 in 2013 PTOT 160 140 120 100 µg/l 80 PTOT (µg/l), FI PTOT (µg/l), LT 60 PTOT (µg/l), BY 40 PTOT (µg/l), LV 20 0 20 Nov 19 Nov 18 Nov 18 Nov 21 Nov 20 Nov 21 Nov 21 Nov 21 Nov River Border Border Border River River River River River mouth (LT) (LT/BY) (LT/BY) (LV/BY) mouth (LV) mouth (LV) mouth (LV) mouth (LV) mouth (LV) Nemunas Nemunas Neris Daugava Daugava Barta Venta Lielupe Gauja
Phosphorus concentrations Daugava 120 in May 100 80 µg/l 60 40 20 0 River mouth Belarus border Nemunas-Neris Nemunas Tot-P PO4-P 120 100 100 80 80 60 µg/l µg/l 60 40 40 20 20 0 0 River mouth Belarus border River mouth Belarus border Tot-P PO4-P Tot-P PO4-P
Nitrogen concentrations in May Daugava 1500 1000 µg/l 500 0 River mouth Belarus border Nemunas Tot-N NO3+NO2-N 2000 1500 Nemunas-Neris µg/l 1000 2000 500 1500 µg/l 0 1000 River mouth Belarus border 500 Tot-N NO3+NO2-N 0 River mouth Belarus border Tot-N NO3+NO2-N
Phosphorus Daugava 120 concentrations 100 in November 80 µg/l 60 40 20 0 Nemunas River mouth Border 100 Tot-P PO4-P 80 60 Nemunas-Neris µg/l 100 40 80 20 60 µg/l 0 River mouth Border 40 Tot-P PO4-P 20 0 River mouth Border Tot-P PO4-P
Nitrogen concentrations Daugava in November 2000 1500 µg/l 1000 500 0 River mouth Belarus border Nemunas Tot-N NO3+NO2-N 3000 2500 Nemunas-Neris 2000 µg/l 3000 1500 2500 1000 2000 500 µg/l 1500 0 1000 River mouth Belarus border 500 Tot-N NO3+NO2-N 0 River mouth Belarus border Tot-N NO3+NO2-N
Tot Total al ph phos osph phor orus us (Tot (Tot-P) P) an and d nitr nitrog ogen en (Tot (Tot-N) N) co conc ncen entr trat ations ions at at the the mou mouth th of of th the e rive river r Ne Nemun munas as
Total Total ph phosp ospho horu rus s (Tot (Tot-P) P) concentra tration tions s me measu sure red at th t the bo bord rder r bet between een Lat Latvi via and Belarus a a and Belarus as s well ell as at tw as at two o separ separate ate sampli sampling ng si sites tes (Ri (Riga ga I I and and II) II) nea near r to the mouth to the mouth of t of the river he river Dau Dauga gava va in in 20 2013 13
Total Total nitro nitroge gen n (Tot (Tot-N) N) concentra tration tions s me measu sure red at t th the bord rder r betwe tween Lat Latvi via and Belarus a a and Belarus as s well ell as as at two sep at two separa arate te sampli sampling si ng sites tes (Ri (Riga ga I I and and II) II) nea near to the mouth of the riv r to the mouth of the river er Dau Dauga gava va in in 20 2013 13
Total phospho Total phosphorus rus load of t load of the he Daugava Daugava in 199 in 1991-2013 2013 measured measured at at the ri the river ver mouth and mouth and the B the Belorussian elorussian borde border
Total ni Total nitrogen load trogen load of t of the he Daug Daugava ava in 199 in 1991-2012 2012 measured measured at the river mouth and at the river mouth and the B the Belorussian elorussian borde border
Total phospho Total phosphorus rus load of t load of the he Nemuna emunas in 1 in 199 994-2013 2013 measured measured at at the ri the river ver mouth and mouth and the B the Belorussian elorussian borde border
To Total nitr tal nitrog ogen en l loa oad d of the of the Nemu Nemuna nas in 19 in 1994 94-20 2012 12 mea measure sured d at the river mouth (H at the river mouth (HELCO ELCOM PLC data base) M PLC data base) and and the the Bel Belorussian orussian borde border r
Tota Total l phos phosphor phorus us load load measur measured ed at the at the bord border er betwee between n Latv Latvia ia and and Belarus Belarus
Tota Total l nitrog nitrogen en load load measur measured ed at at the bor the border der betwee between n Latv Latvia ia and and Belar Belarus us
Tota Total l phos phosphor phorus us load load measur measured ed at the at the bord border er betwee between n Lithuan Lithuania ia and and Belarus Belarus
Tota Total l nitrog nitrogen en load load measur measured ed at at the bor the border der betwee between n Latv Latvia ia and and Belar Belarus us
Thank you !
Recommend
More recommend