Monitor for detecting and assessing exposure to airborne - PowerPoint PPT Presentation
Monitor for detecting and assessing exposure to airborne nanoparticles Johan Marra 1 , Matthias Voetz 2 , Heinz-Jrgen Kiesling 2 1 Philips Research Laboratories; Eindhoven 2 Bayer Technology Services; Leverkusen 4 November, 2008 Current
Monitor for detecting and assessing exposure to airborne nanoparticles Johan Marra 1 , Matthias Voetz 2 , Heinz-Jürgen Kiesling 2 1 Philips Research Laboratories; Eindhoven 2 Bayer Technology Services; Leverkusen 4 November, 2008
Current situation • Increasing societal significance of the nanomaterials industry; • Increasing reliance on processes / products comprising nanoparticles (NPs); • Hazards associated with many engineered NPs still unknown; • Increasing awareness about potential NP exposure risks; Proposed safety measures in the workplace are pragmatic: - Exposure minimization; - Continuous monitoring of the workplace environment; - Monitoring of the worker’s cumulative exposure; Portable NP monitors needed for quantifying the NP exposure and the associated relative health risk CONFIDENTIAL 2 Philips Research Laboratories, Author, August 21, 2008
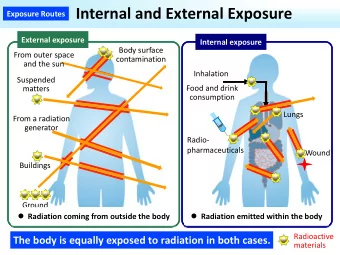
Exposure risk NP deposition in respiratory tract 1 Fractional deposition efficiency 0.8 NPs / UFPs HA DFAL( dp ) 0.6 DFTB( dp ) AL 0.4 DFHA( dp ) TB 0.2 0 1 103 1 104 1 10 100 1000 10.000 dp 103 d p (nm) . Chemical particle composition, size, and shape ( Hazard ) Particle number concentration N Average particle size d p,av Deposited particle surface area S in the lungs CONFIDENTIAL Philips Research Laboratories, Author, August 21, 2008 3
The Aerasense nanoparticle sensor time Air out I sensor = I 1 I sensor = I 2 Fan I sensor = 0 Sensing section Current meter attached to Faraday V pl = V 1 cage for measuring I sensor V pl V pl = 0 Precipitation V scr section Needle-tip electrode surrounded by a Charging section screen electrode V cor Air in Key finding:- particle charge Q(d p ) ∝ d p CONFIDENTIAL 4 Philips Research Laboratories, Author, August 21, 2008
Inferring from sensor signals I 1 and I 2 - UFP number concentration N (particles/cm 3 ) - Average UFP diameter d p,av (nm) - Particle surface area concentrations S that deposit in - the head airways ( S HA ) - the tracheo-bronchial region ( S TB ) - the alveolar region ( S AL ) - Air pollution index P (relative exposure-induced health risk) CONFIDENTIAL 5 Philips Research Laboratories, Author, August 21, 2008
Inferring an apparent number concentration N app from I 1 (for particles sized ≈ 10 – 300 nm) 20 3 ) -6 (part.nm/cm R 2 = 0.9992 16 12 8 Nd p,av *10 4 0 0 200 400 600 800 1000 I 1 (fA) ∝ = I Nd L 1 , p av * app = = N C I N app d , av 1 p N app CONFIDENTIAL 6 Philips Research Laboratories, Author, August 21, 2008
Inferring the real number concentration N from I 1 and I 2 (for particles sized ≈ 10 – 300 nm) 8 3 ) -5 (particles/cm R 2 = 0.996 6 4 2 N *10 0 0 100 200 300 400 500 600 (I 1 -I 2 ) (fA) ( ) ( ) ∝ − = − N I I N C I I 1 2 1 2 N CONFIDENTIAL 7 Philips Research Laboratories, Author, August 21, 2008
Inferring the average particle diameter d p,av from I 1 and I 2 (for particles sized ≈ 10 – 300 nm) 140 120 R 2 = 0.9751 100 d p,av (nm) 80 60 40 20 0 0 2 4 6 8 I 1 /(I 1 -I 2 ) L I = d = 1 d C , p av , p av dp N − I I 1 2 CONFIDENTIAL 8 Philips Research Laboratories, Author, August 21, 2008
Inferring the deposited surfaces areas S HA , S TB and S AL from I 1 (ICRP model for reference worker) 250 N = 100.000 200 Alveolar region S ( µ m 2 /cm 3 ) part/cm 3 Sappha ( dp1av ) 150 Sapptb( dp1av ) 100 Tracheo-brochial region Sappal ( dp1av ) 50 Head airways 0 0 20 40 60 80 100 dp1av109 . d p,av (nm) ∝ ∝ S Nd I , 1 HA p av ∝ ∝ + + = = S Nd I S S S S C I , 1 1 TB p av HA TB AL total S ∝ ∝ S Nd I , 1 AL p av CONFIDENTIAL 9 Philips Research Laboratories, Author, August 21, 2008
Inferring air pollution index number P from I 1 Assumption: - Exposure risk ∝ S total ∝ Nd p,av ∝ I 1 - Safe threshold concentration (Nd p,av ) ref, ∝ (I 1 ) ref depending on particle toxicity Nd I ( ) ref , p av 2 log 2 log 1 = = P 1 ≥ ( ) I I ( ) for 1 Nd I , 1 p av ref ref ( ) ref 0 = P 1 < I I for 1 Relative health risk incurred through exposure can be indicated via P through either a number or a color CONFIDENTIAL 10 Philips Research Laboratories, Author, August 21, 2008
Ultrafine particle measurements in outdoor air N (part/cm 3 ) N (part/cm 3 ) Outdoor air Outdoor air P P P(t) P(t) P(t) P(t) time (hours) time (hours) CONFIDENTIAL 11 Philips Research Laboratories, Author, August 21, 2008
Comparison Aerasense NP monitor vs. SMPS Particle number concentration 100 ■ SMPS N*10 -3 (particles/cm 3 ) ■ SMPS NP monitor 80 NP monitor 60 40 20 0 19:45 21:45 23:45 1:45 3:45 5:45 time (hh:mm) CONFIDENTIAL Philips Research Laboratories, Author, August 21, 2008
Average particle diameter 100 ■ SMPS 80 NP monitor d p,av (nm) 60 40 20 0 19:45 21:45 23:45 1:45 3:45 5:45 7:45 9:45 time (hh:mm) CONFIDENTIAL Philips Research Laboratories, Author, August 21, 2008
Conclusions Proposition of a (portable) NP monitor capable of - exposure monitoring, both indoors and outdoors; - relative exposure-induced health risk assessment via S total ; - characterizing the NP pollution in terms of N and d p,av ; - assessing the cumulative NP exposure; - tracing emission sources of NP pollution; - monitoring effectiveness of exposure minimization measures; - awareness creation about extent / hazards of the NP pollution Note: Aerasense monitor on display at the Aerasense booth Wednesday: Additional presentation about equipment CONFIDENTIAL 14 Philips Research Laboratories, Author, August 21, 2008
Recommend


More recommend
Explore More Topics
Stay informed with curated content and fresh updates.